Back to top

Introduction


Mathematical monitoring of Barcelona’s urban drainage system serves as a starting point for analysing the flood hazard and evaluate the impact these floods on the urban services analysed in the project, as well as on people and assets. The urban drainage model used by the RESCCUE project is based on the model developed by Barcelona Cicle de l’Aigua (BCASA), for the Barcelona Sanitation Master Plan (PDISBA’19)

The main feature of the new model lies in modelling the city’s entire drainage system, both primary and secondary, characterizing all the singular elements that compose it (grids, drains, retention tanks, valves, pumping stations, etc.). The so-called 1D/2D model combines the underground drainage system with the behaviour of surface water circulation – the model’s main new feature – which allows information to be provided on the water variables depth, speed and extension of flooded areas in the city during rainfall episodes.

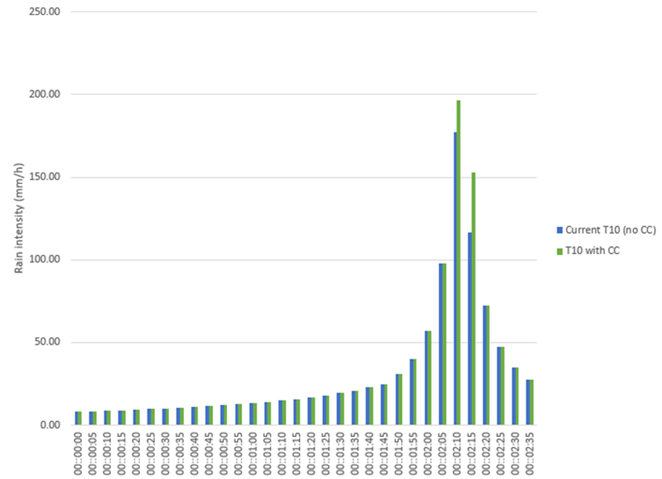
Calibration of the urban drainage model was developed according to the 10-year (T10) return period rainfall design, which is calculated on the basis of statistical models, establishing the total duration of the rainfall pattern and enables us to find out the moment when the highest or peak rainfall intensity occurs. Figure 1 compares the rainfall design for a 10-year return period calculated with rainfall data up to 2018 with the forecast for 2071-2100 in accordance with the climate change coefficients considered in the project. Current rainfall can be seen in blue and the future forecast in green. It shows how peak intensity increases considerably with climate change.


Figure 1. Comparison between the rainfall design for the current scenario (T10) and the future scenario (T10 CC) corresponding to the 10-year return period and the time horizon 2071-2100. Source: BCASA.

Once the model has been validated, the different return periods (T1, T10, T50, T100, T500) were simulated for the current scenario and the future scenario, applying the climate change factors obtained from the precipitation projections resulting from the statistical regression of 20 pluviometric series provided by 10 global climate models forced by the RCP 4.5 and 8.5, previously validated for the historical period 1976-2005.

Behaviour of the drainage system


Based on the new climate projections developed within the project framework, the intensity of torrential rainfall episode in the city is forecast to increase by between 29% and 40%. Bearing in mind that the drainage system is already suffering major overflows with rainfall that has a 10-year return period, this increase in precipitation intensity could lead to an increase in the city’s flood-prone areas, if adaptation measures that help to increase the drainage capacity are not adopted.

From the simulated design rainfall associated with different return periods (T1, T10 and T100) for both the present and future scenarios – which take the climate change projections into account – we can extract the behaviour of the drainage system and the percentage of linear metres of pipes, compared to the total length of the system, which become overloaded or suffer overflows.


Figure2. Behaviour of the drainage system in the current (BAS) and future (BAU) scenarios in percentage of linear metres of pipes compared to the total length of the system. Source: BCASA.

Obviously, as the return period increases, there are fewer sections of collector pipes where water circulates freely through the pipes, as they are increasingly in demand. In the simulation of the future climate change scenario with a 10-year (T10) return period, we can observe the worsening in the operation of the drainage system compared to its current state. The sections where water circulates on the surface increase from 24% to 28%, while the sections where the water flows freely through the pipes fall from 40% to 36%. If we observe the simulations for the 100-year (T100) return period, we see the sections where water circulates above ground rise to 44% of the total pipe network, while the sections where water flows freely underground drop from 27% to 22%. It can be deduced that the insufficient sizing of the sewer networkfor high return periods will lead to flooding problems in large areas of the city.

Risk areas


The urban drainage model enables us to analyse the behaviour of water on the surface by setting the parameters for its speed and depth, and therefore know the extent of the city’s flood plains. The following map shows how the urban flooding varies for the most important return periods: T10 to represent a normal frequency and T100 to represent episodes of high intensity rainfall, for both the current scenario and the future one.

By selecting the different layers, we can see how the height of surface water varies depending on the return period considered. At the same time it is possible to compare the change in the current state and the future state due to the effects of climate change.

Source: PDISBA'19 (BCASA) - RESCCUE Project

As we can see on the map, the city’s most critical points are as follows:

1. Diagonal – plaça de Francesc Macià
2. Urgell / Casanova / av. Roma
3. Ronda Sant Pau – av. Paral•lel
4. Around del carrer de Sant Pau
5. Diagonal (Bruc – Roger de Flor)
6. Clot – Navas
7. Via Augusta - Príncep d’Astúries - rambla del Prat
8. Around de la rambla de Prim
9. Plaça de Llucmajor
10. Tajo – Cartellà
11. Carrer Parcerisas
12. Carrer de la Riera Blanca
13. Around de la Seat (Zona Franca)
14. Torrent de Tapioles

Adaptation


Having evaluated the deterioration in the drainage system’s performance, the project turned to evaluating the adaptation measures that help to increase its drainage capacity. These measures were differentiated in two adaptation scenarios: the first envisages the installation of SUDS (sustainable drainage systems) in the city – Adapt. 1 – and the second envisages the introduction of structural improvements to the drainage system (improvement of pipes, installing rainwater retention tanks, etc.) together with SUDS – Adapt. 2.

Below we show the urban flooding resulting from the simulation of the models following the introduction of adaptation scenarios 1 and 2 for the most significant return periods (T10 and T100):

Source: PDISBA'19 - RESCCUE Project


The map enables us to see how by applying the adaptation scenarios we reduce the extent of the flood-prone areas in the city compared to the future scenario with climate change (the dark blue areas are not as dark and the light blue ones disappear). If we specifically analyse the most critical parts of the city as regards the risk of flooding without adaptation measures (highlighted in orange) we can see how this reduction is noticeable in the two adaptation scenarios and return periods, although it is particularly noticeable in the 10-year return period and with the Adaptation 2 scenario measures (SUDS and structural). In fact, there is a very considerable improvement in this latter scenario because we see the risk zones of Ronda de Sant Pau – Av Paral·lel, around Carrer de Sant Pau, Av Diagonal (C Bruc - C Roger de Flor) and around Rambla de Prim have disappeared completely. This latter result clearly shows the positive impact of the structural works being carried out, namely splitting the big interceptor pipe on Av Diagonal, the Av del Paral·lel draining axis and Carrer de Vila i Vila, and the underground rainwater regulation tank of the Av de Prim draining axis.

On the other hand, if we compare the future scenario – that is, the current state of the city affected by the future rainfall conditions due to climate change – with the different adaptation scenarios, we get the improvement in the behaviour of the drainage system as a percentage of linear metres of pipes, compared to the total length of the pipe network, that become overloaded or suffer overflows.


Figure 3. Behaviour of the drainage system in the future (BAU) and Adaptation 1 (SUDS measures) scenarios as a percentage of linear metres of pipes compared to the total length of the system. Source: BCASA.


Figure 4. Behaviour of the drainage system in the future (BAU) and Adaptation 2 (SUDS measures) scenarios as a percentage of linear metres of pipes compared to the total length of the system. Source: BCASA.


Obviously, as the Adaptation 2 scenario includes the SUDS measures of the Adaptation 1 scenario, it obtains better results (that is, increased length of the free-flowing sections and less in the case of those working under pressure or above ground, for example).

A look at Figures 3 and 4 for the rainfall of a 10-year return period with climate change shows none of the adaptation scenarios manage to avoid flooding completely (that is with 100% of the system flowing freely) but the reductions compared to the future scenario with climate change are very significant, with as much as 83% of the system working in the Adaptation 2 scenario.

It is important to point out that the latter scenario takes into account the proposed actions for the city’s primary system and considers the secondary system has sufficient capacity.

Urban impact

The results of the flooding simulations show that Barcelona could suffer a significant increase in these impacts in a potential context of climate change. The rest of sections deepen more about how the effects of flooding have been evaluated in terms of hazard, vulnerability and risk. The results of that evaluation are represented by means of risk maps for the following urban services in the event of flooding: mobility and waste resources , as well as the effects on pedestrians and vehicles , on properties and the impact on bathing water quality to assess the impacts of discharges into the receiving environment.


To consult the full study, click HERE.

To consult further information on the project RESCCUE:Visit RESCCUE

nt.match(/Trident.*rv\:11\./)) { $('html').addClass('ie11'); }