Introduction
When urban flooding occurs, surface runoff could result in indirect damage due to the traffic disruption. The RESCCUE project has assessed the reduction of travel speeds across the different transects in relation to the depths of water flow present. This type of analysis enabled a flood risk assessment to be carried out in the surface transport sector. Furthermore, the modelling results have been used to feed the TransCAD dynamic transport model used by Barcelona City Council's Mobility Department to estimate the impacts on the transport services caused by pluvial flooding in the city.
The hydrodynamic model provides a surface flood depth for each domain cell. These flood depths are used to create hazard maps based on specific hazard criteria. The methodology, developed by Exeter University, is shown in the following figure.
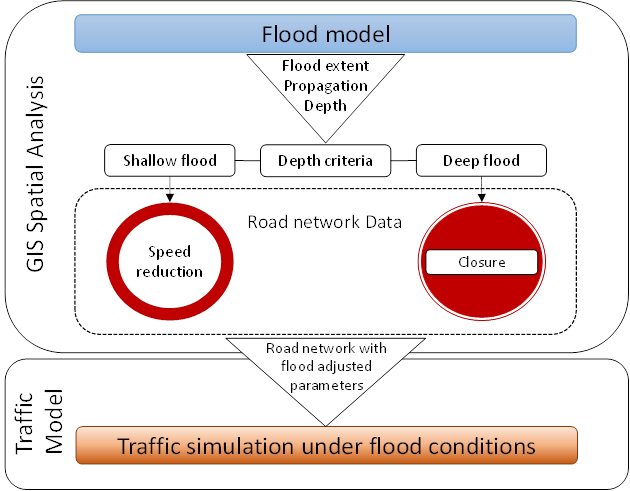
In order to assess the danger of flooding in the road infrastructure, a GIS spatial analysis has been carried out applying the traffic speed reduction rules shown in the following table:
| Flood depth range (cm) | Maximum permitted speed (km/h) | 0.00 – 10.00 | Maximum permitted road speed (no disruption) |
|---|---|
| 10.00 – 30.00 | 20 (reduced speed) |
| 30.00 + | 0 (road closed) |
Risk areas
Among other traffic parameters, the TransCAD traffic model includes the maximum permitted speed in each street section. Based on the depths of water calculated in the 1D/2D hydrodynamic model in all the scenarios and return periods studied, and taking into account the effects that the danger of flooding has on traffic, the maximum permitted speed limits in each of the flooded street sections in the traffic model are changed and the model is run again with these new conditions.
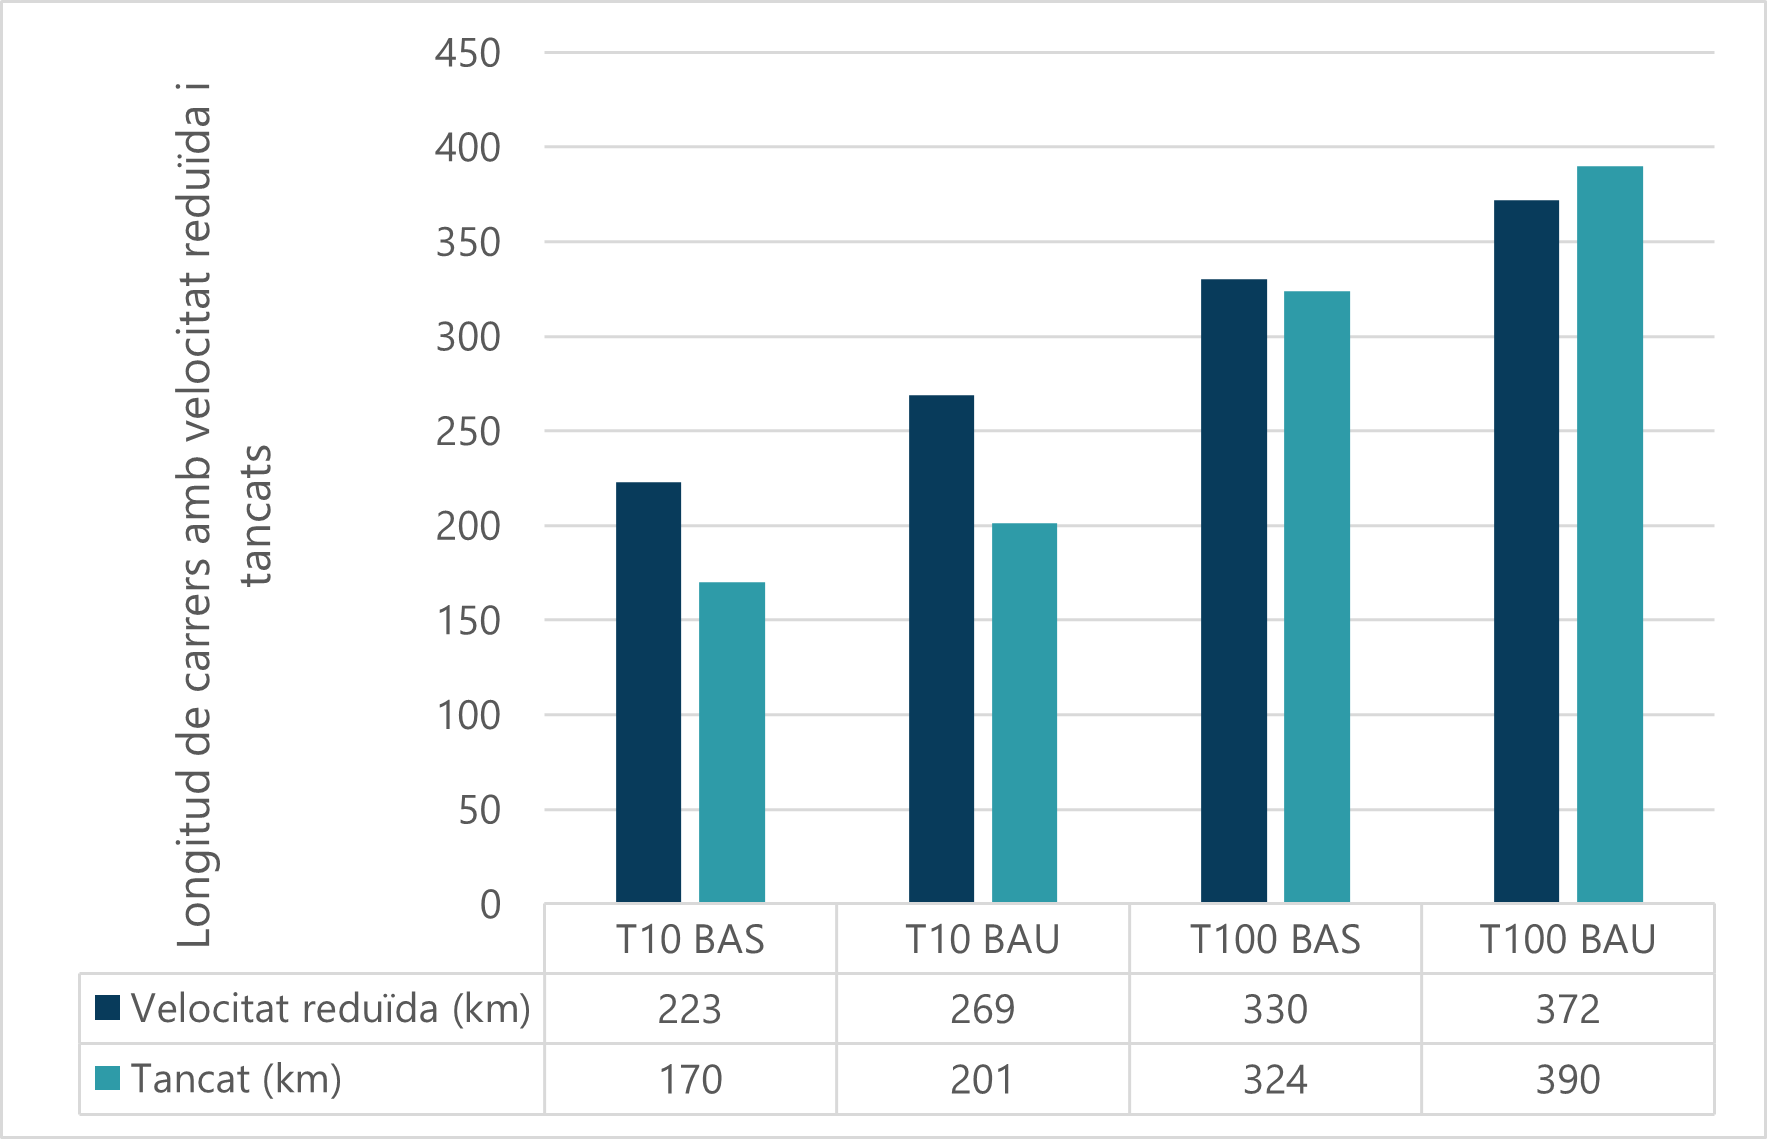
Based on the methodology outlined, qualitative risk maps have been produced classifying the risk for three levels: low (no traffic disruption), medium (causes speed reduction on the streets) and high (causes street closures), for the current situation and for the climate change scenarios provided by the climate projections developed in the project. The maps below show the disruption to surface traffic caused by the risk of flooding, represented by closed streets and streets with reduced speed, in the current and future scenarios for the T10 and T100 return periods.
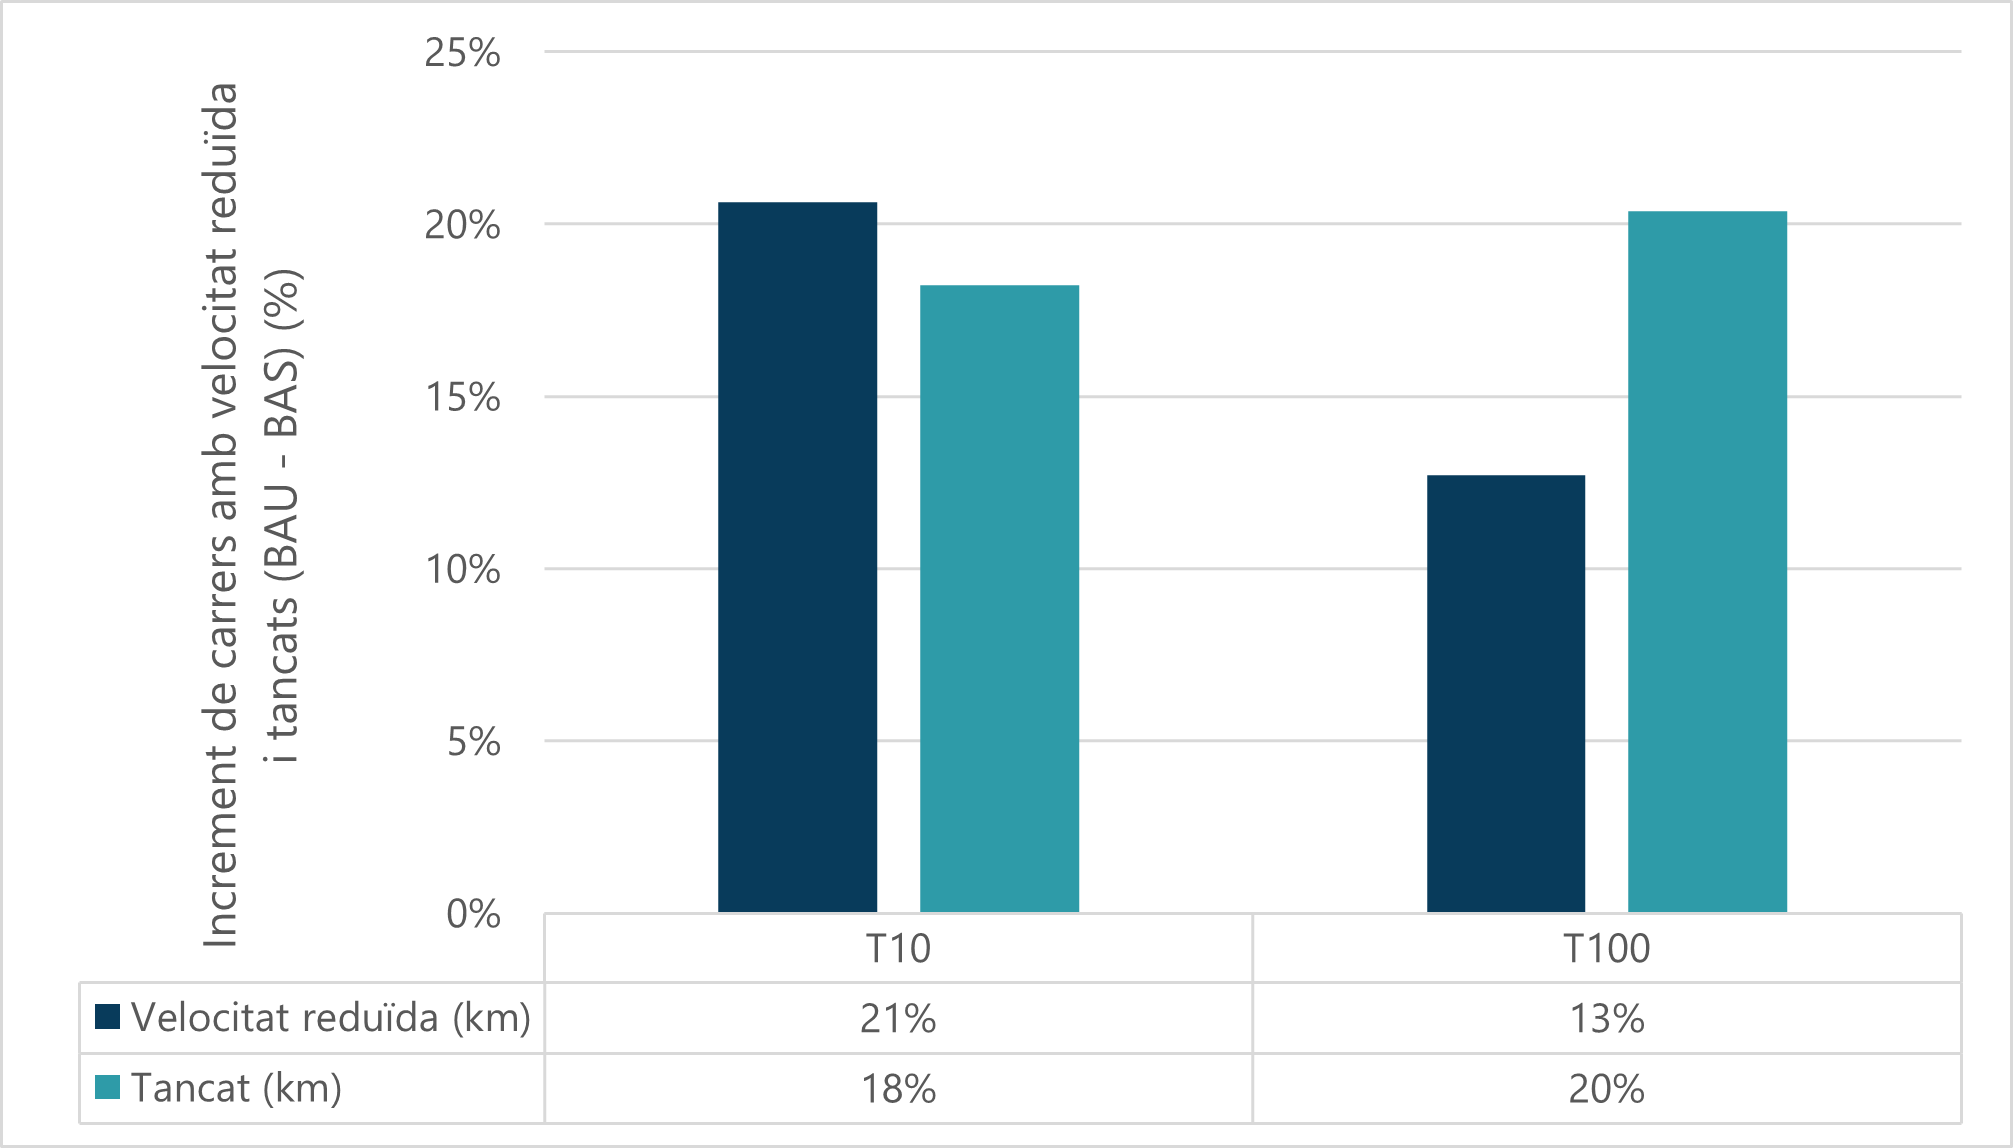
As the maps show, the effects of climate change imply an increase in the number of streets with reduced speed and those closed to traffic. Comparing the results of the two scenarios (current and future) we can see that, for a total road network of 1,492 km, the increase in the number of streets that could be affected by a reduction in road speed varies between 13% and 21% depending on the return period, whereas the increase in the number of streets closed could be approximately 20% in both return periods (Figure 3).