New projections for a better understanding of how climate change will affect Barcelona
The consequences of climate change for a variety of sectors and how they interrelate have been studied within the framework of the RESCCUE project. To that end, climate and meteorological information was collected in advance, and climate projections were developed. In this case they were led by Fundación para la Investigación del Clima [Climate Research Foundation] or FIC, a Madrid-based research centre specialising in climate and meteorological phenomena.
These new projections come in addition to the ones already drawn up by the Catalan Meteorological Service (SMC) in the study commissioned by the Barcelona Metropolitan Area and coordinated by Barcelona Regional, “Generation of Future Climate Scenarios Regionalised at Very High Resolution (1 km) for the Barcelona Metropolitan Area” (ESAMB Project, 2016), which Barcelona City Council was allowed to use to draw up its “Study of the Impacts of Climate Change in Barcelona” within the framework of the Climate Plan.
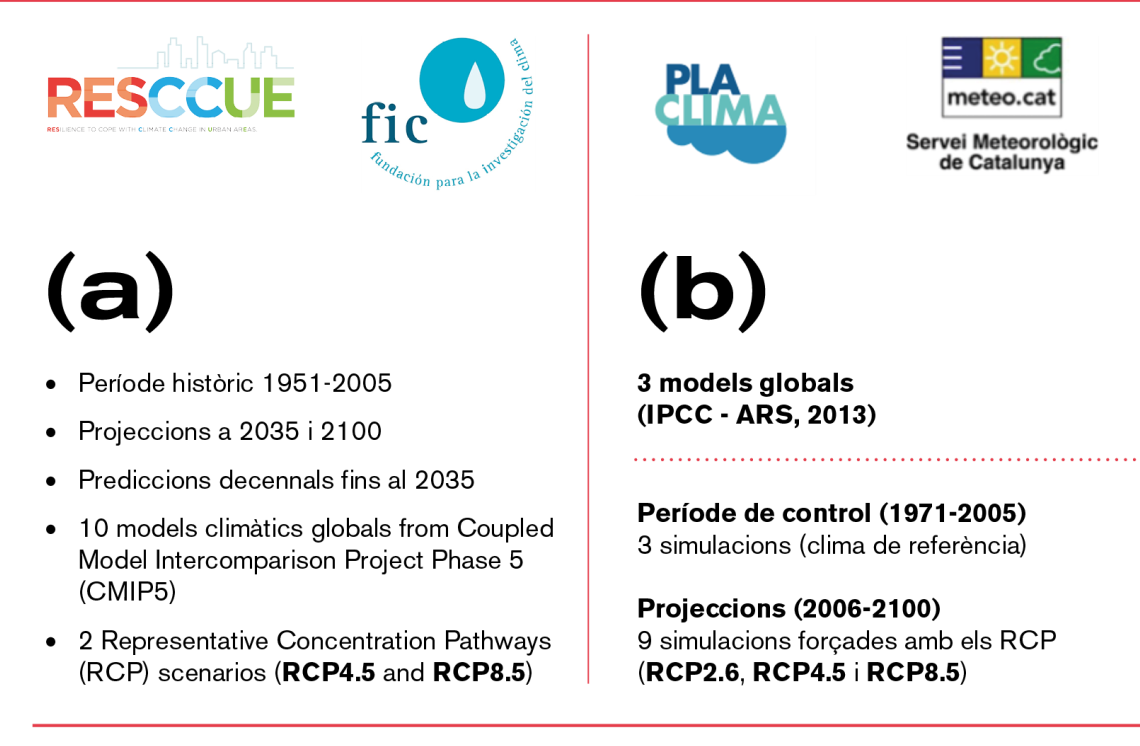
The new climate projections have been developed using the scenarios set out in the fifth report of the Intergovernmental Panel on Climate Change (IPCC) which are referred to as the Representative Concentration Pathways (RCP), with two time horizons (2035 and 2100) and forecasts for every decade until 2035:
RCP4.5, which is referred to as the compromise scenario in the Climate Plan:
the scenario that would materialise if we managed to reduce greenhouse gas emissions as per the Paris Agreement (2015) targets and mitigated the concentration of GHG after 2030. This would be equivalent to a radiative forcing (the energy increase in the atmosphere as a result of the greenhouse effect) of 4.5 W/m2.
RCP8.5, which is referred to as the 'business as usual' scenario in the Climate Plan:
the scenario that would materialise if we allowed the current trend to continue unchecked. This would be equivalent to a radiative forcing increase of 8.5 W/m2 This would be the worst case scenario.
The methodology developed by the FIC is based on a statistical validation of ten global climate models taken from CMIP5 (Coupled Model Intercomparison Project Phase 5 - IPCC 5th report) for the main climate variables (temperature, precipitation, wind, snow, relative humidity , evapotranspiration and sea level) and for extreme climate events (heat waves, heavy rainfall, warm days, tropical nights, extreme waves). The improvement and increase in number of climate models — compared to what was available in 2016, when the Climate Plan projections were made — at the time of drawing up the climate projections under the RESCCUE project has made it possible to carry out a more detailed comparison and validation of its results, supplementing and improving the information we had until now.
Climate variables
The city's climate in the next few decades will be characterised by longer, hotter summers, with spring and autumn being cut short (and with most of the year's rainfall concentrating in those two seasons) and much milder winters
The future climate scenarios for the main climate variables are now available as a preliminary result of the FIC's work (Table 1). This analysis envisages two spatial scales (one for the Catalonia region and one for the urban area of Barcelona) and two time horizons (2035 and 2100). The medium-term (2035) and long-term (2100) models are RCP-based climate projections added to medium-term projections by decades drawn up using different statistical methods (those appearing as 'drift corrections' and 'teleconnections' in the table below)..
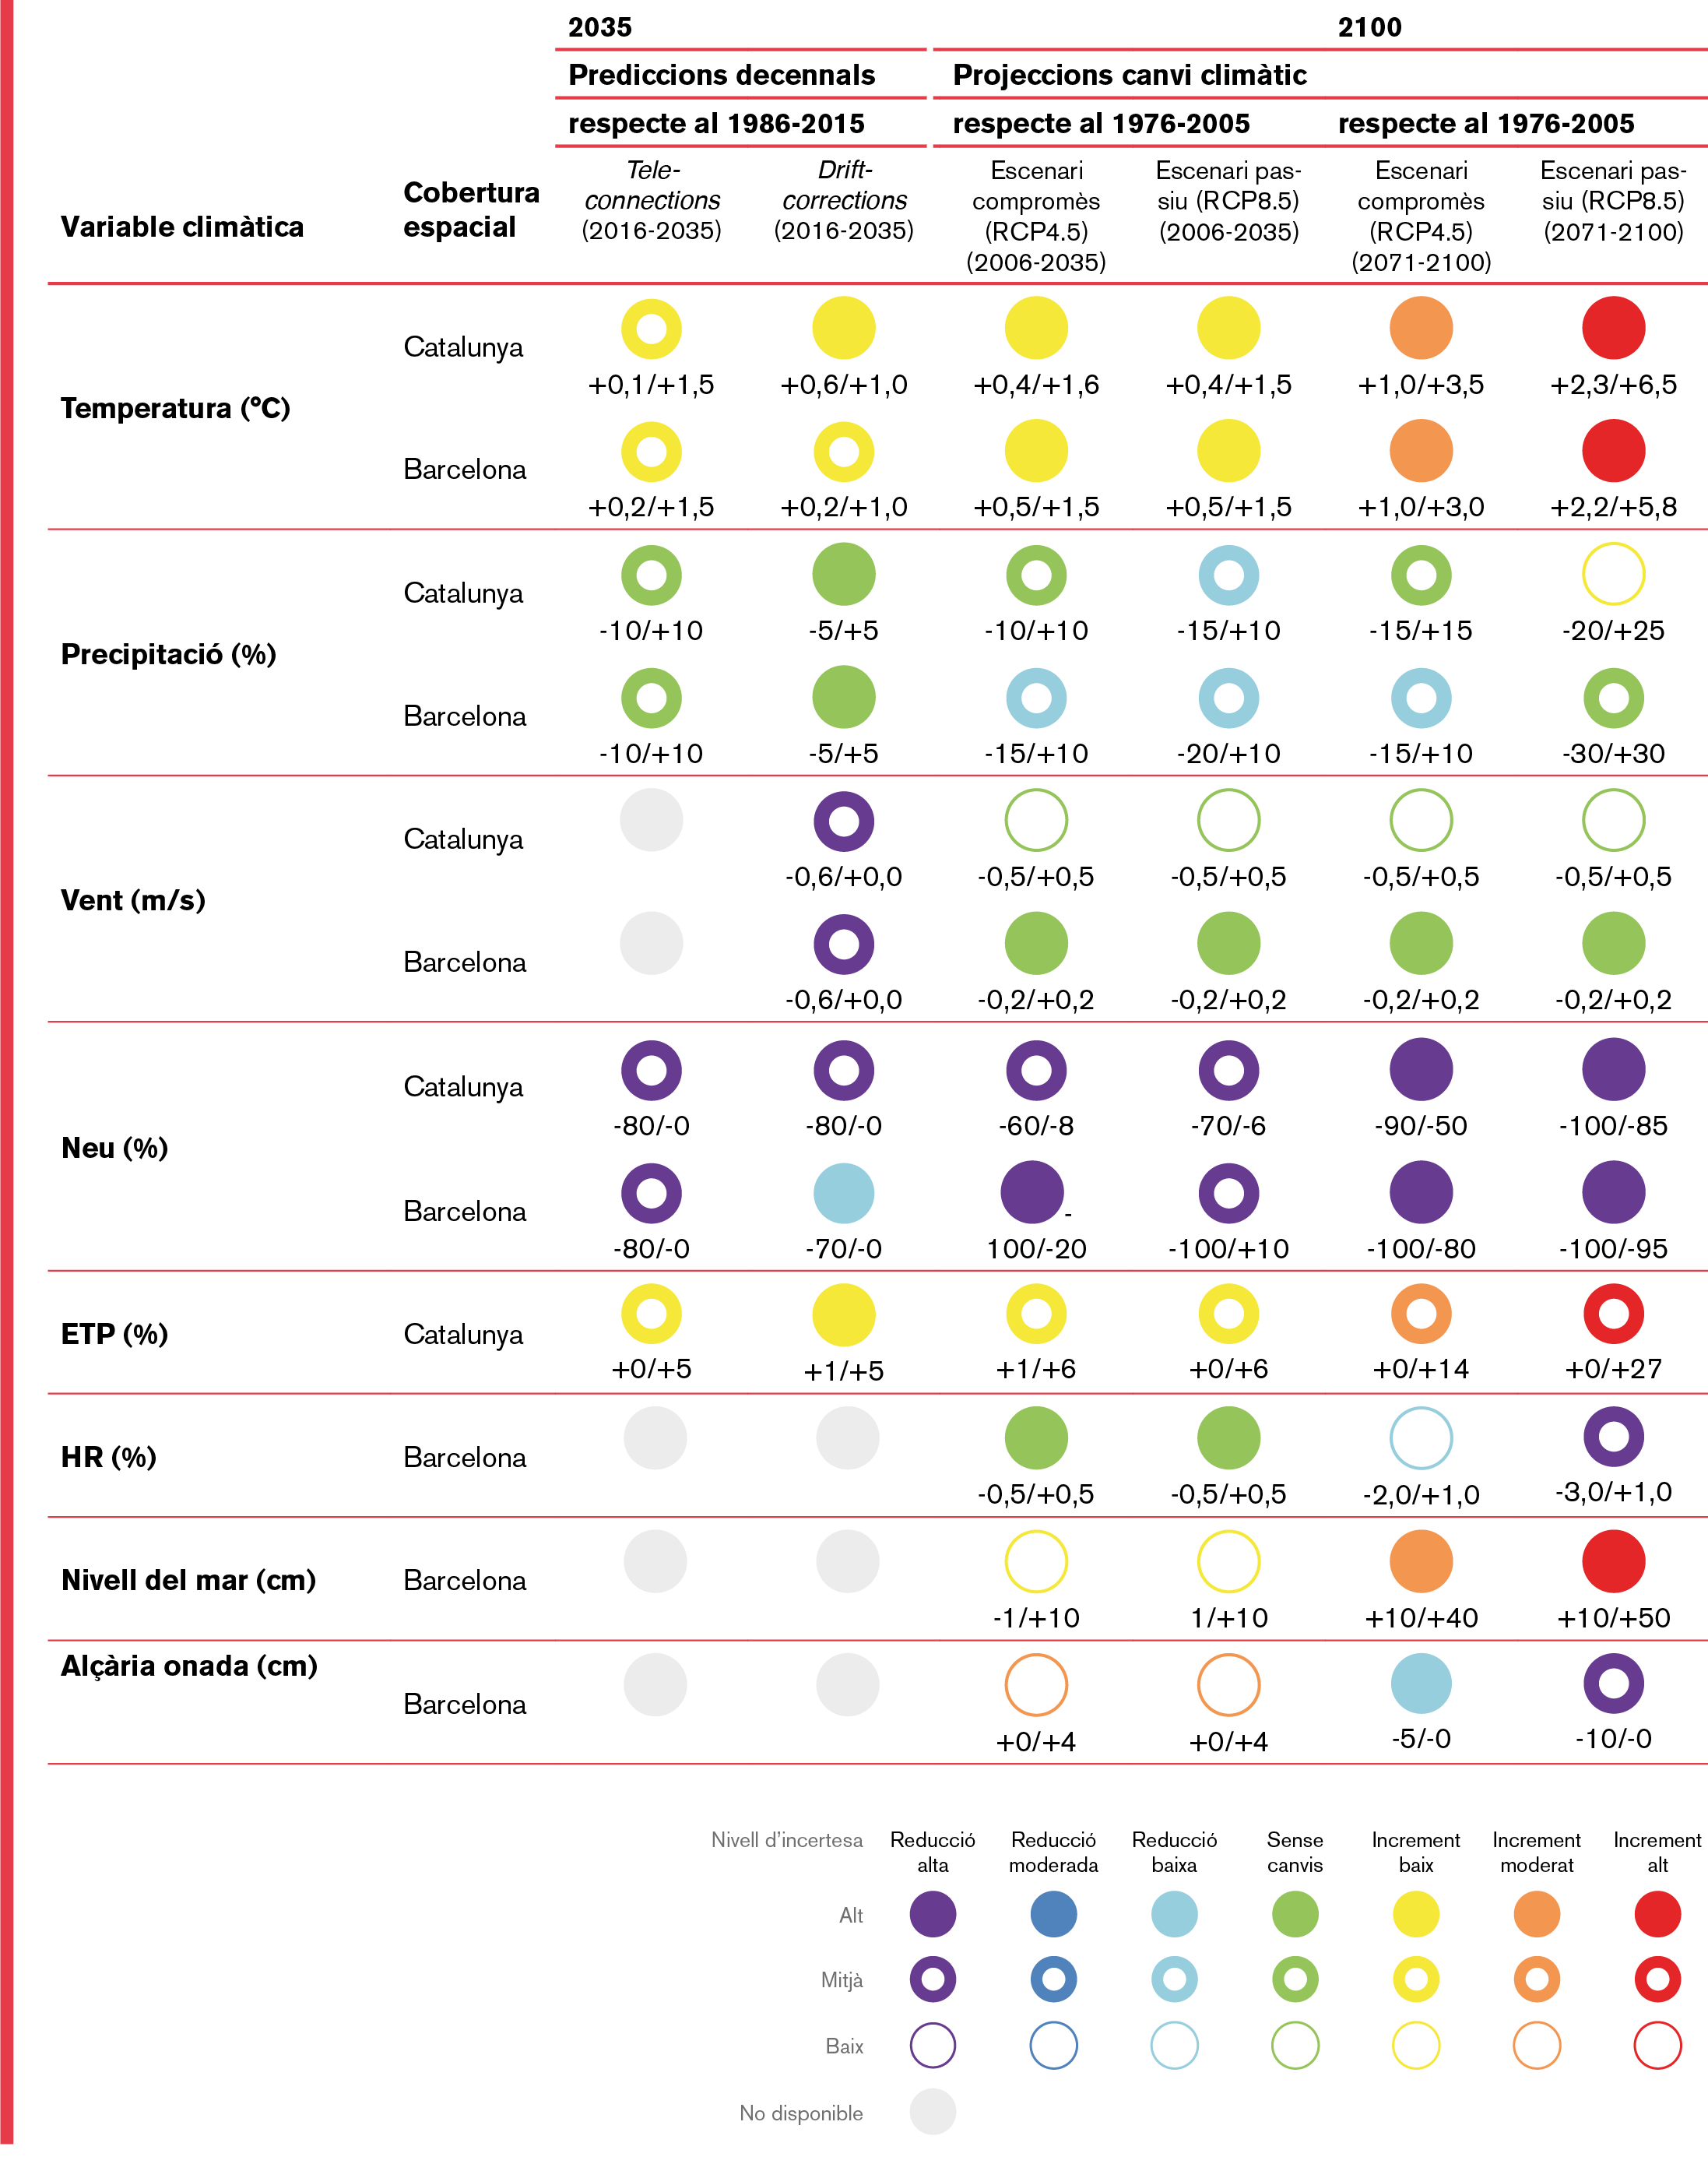
The table shows the changes expected to take place in the variables under analysis, expressed for each range of values and for each level of uncertainty resulting from the statistical validation of the ten climate models employed in the climate modelling. The information in the table shows in particular a gradual increase in average temperature over the coming century, with a sharp increase towards the end of that period. On the other hand, rainfall remains at current levels, although snowfall is quite significantly reduced. This, added to increased evapotranspiration, will result in a shortage of water resources at regional level and will increase the risk of more frequent droughts in future years. As to sea level, the results of the climate models confirm the upward trend of the average level measured in the Port of Barcelona. The results obtained for each climate variable are analysed below.
TEMPERATURE
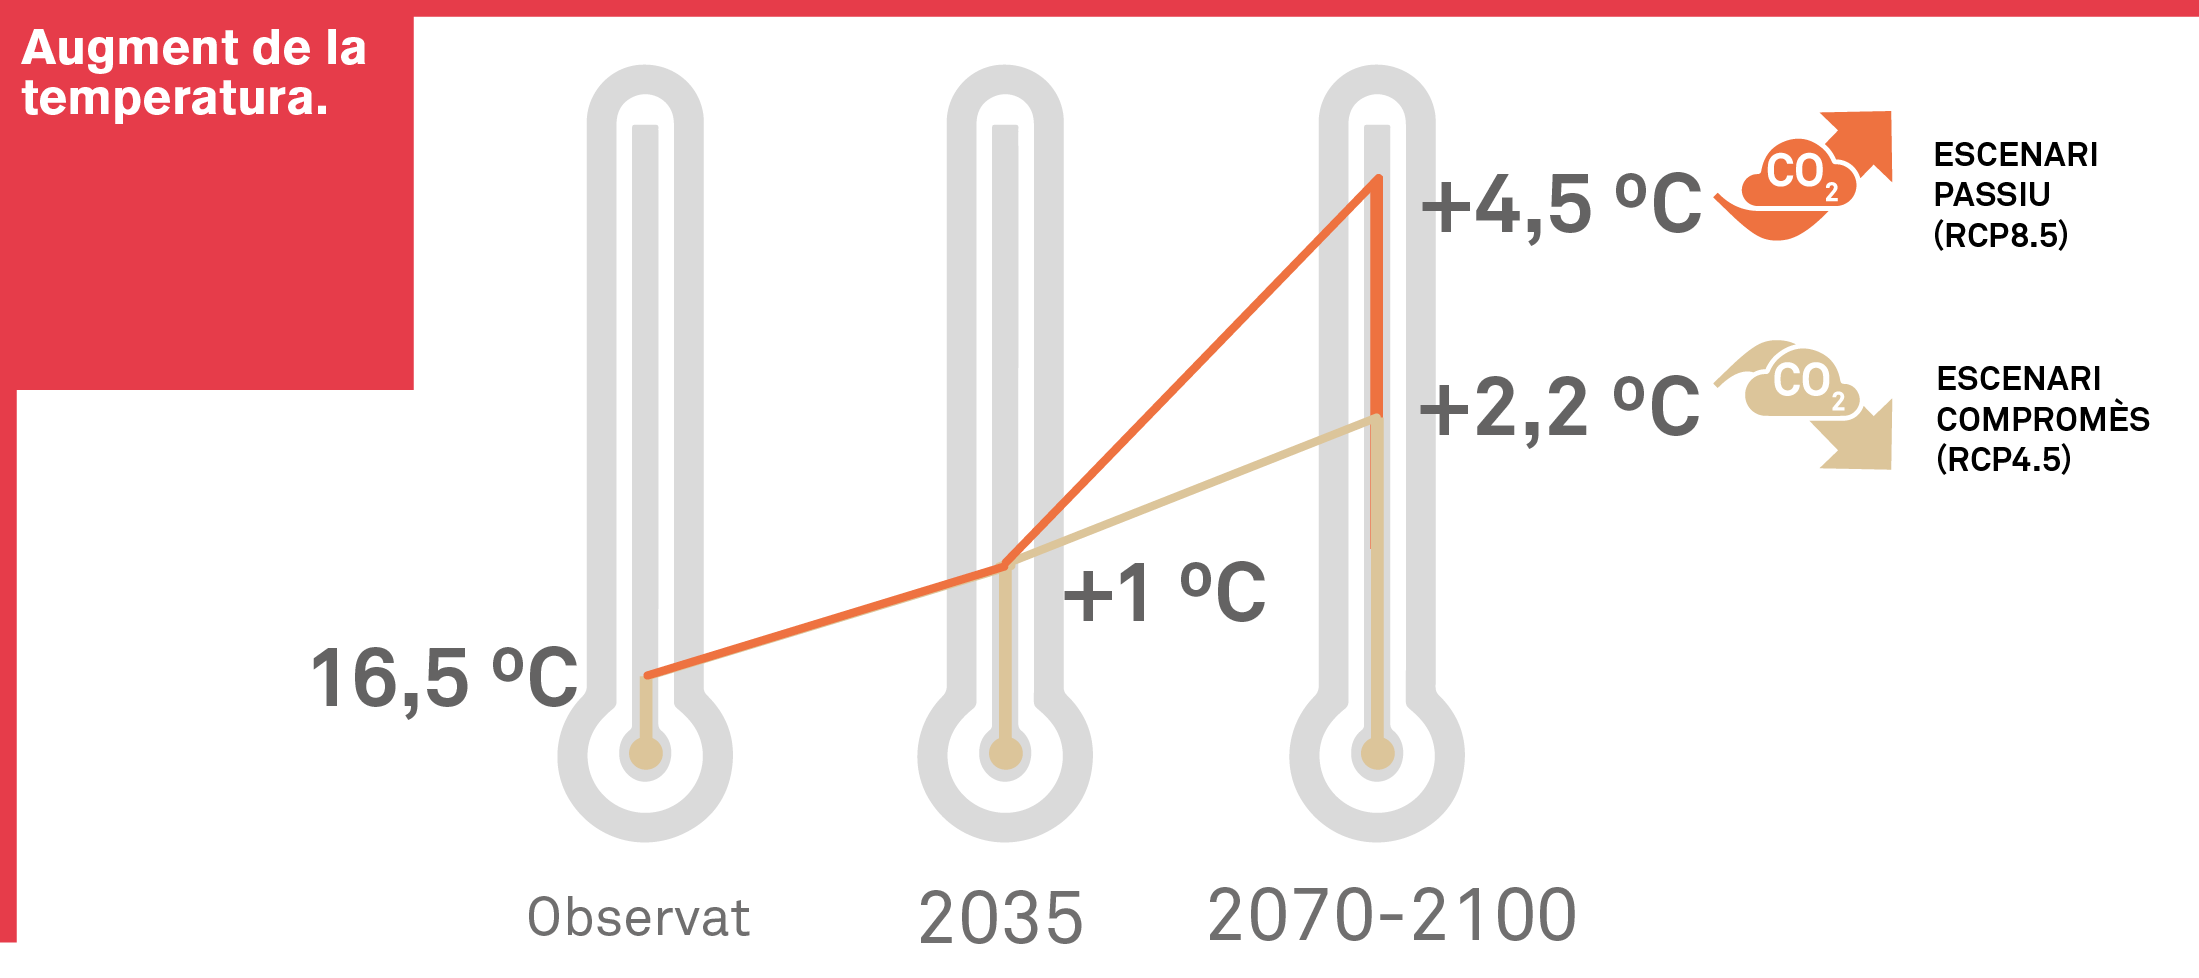
The results of the study confirm a gradual increase in temperatures throughout the year, particularly in the summer. The middle of the century is expected to see a 1 °C increase in both scenarios, and increases of 2.2 °C (in the compromise scenario) and 4.5 °C (in the 'business as usual' scenario) by the end of the century (the most pessimistic result of the ten models used predicts as much as a 6.5 °C increase by 2100).
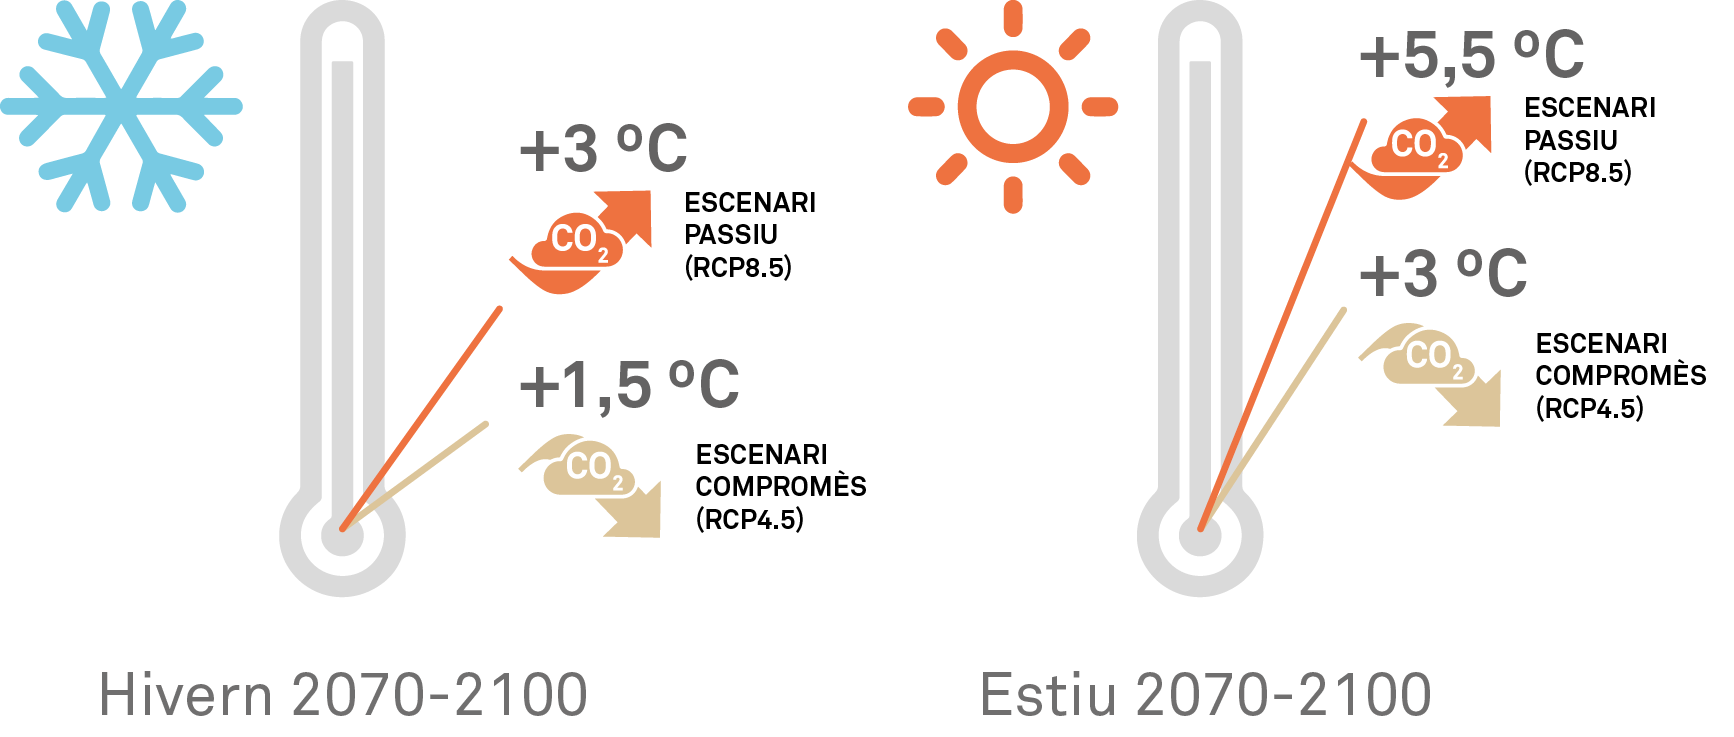
In addition to these average values, the expected figures for each season were also obtained, as the annual averages can be very different from those predicted for each season, for example with winter or summer taking on greater importance due to their extremes. Thus, for example, by the end of the century both spring and autumn temperatures are expected to increase by +2.0 °C for the compromise scenario and by +4.0 °C for the 'business as usual' scenario, whereas winter is expected to experience changes of up to +3.0 °C in the 'business as usual' scenario. Summer is the season when the average rise in temperatures is most dangerous, with rises of +3.0 °C in the compromise scenario and +5.5 °C in the 'business as usual' scenario. In the latter case, the model with the most pessimistic results predicts an increase of up to +8.5 °C.
PRECIPITATION, RELATIVE HUMIDITY AND EVAPOTRANSPIRATION
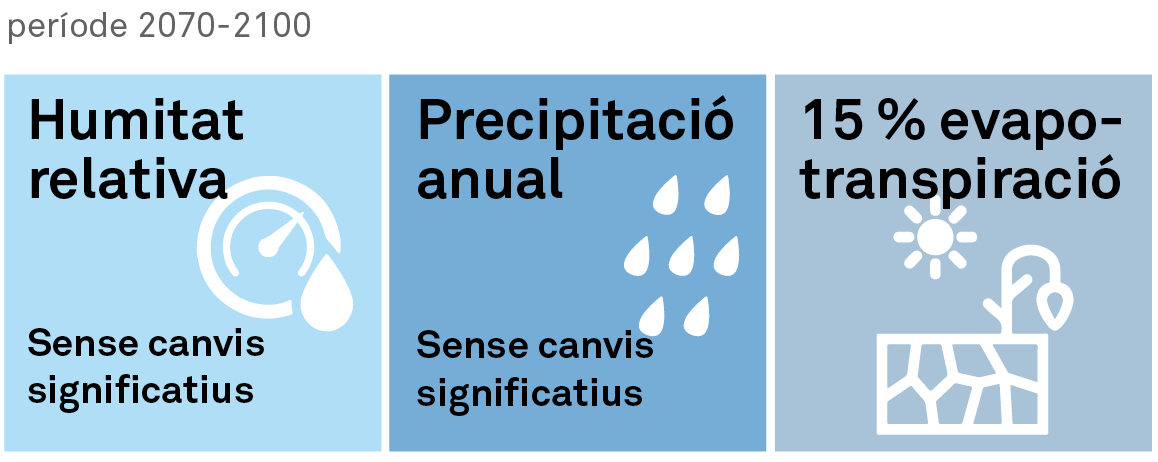
In contrast to this, the annual precipitation figure remains at the current value of around 600 mm, although with more extreme rain events providing most of the rainfall for the year, thus increasing the risk of flooding. No significant changes to relative humidity are expected either.
On the other hand, increased evapotranspiration by the end of the century (+5% in the compromise scenario or RCP4.5, and +15% in the 'business as usual' scenario or RCP8.5) and less water in watersheds will result in worse droughts.
SEA VARIABLES
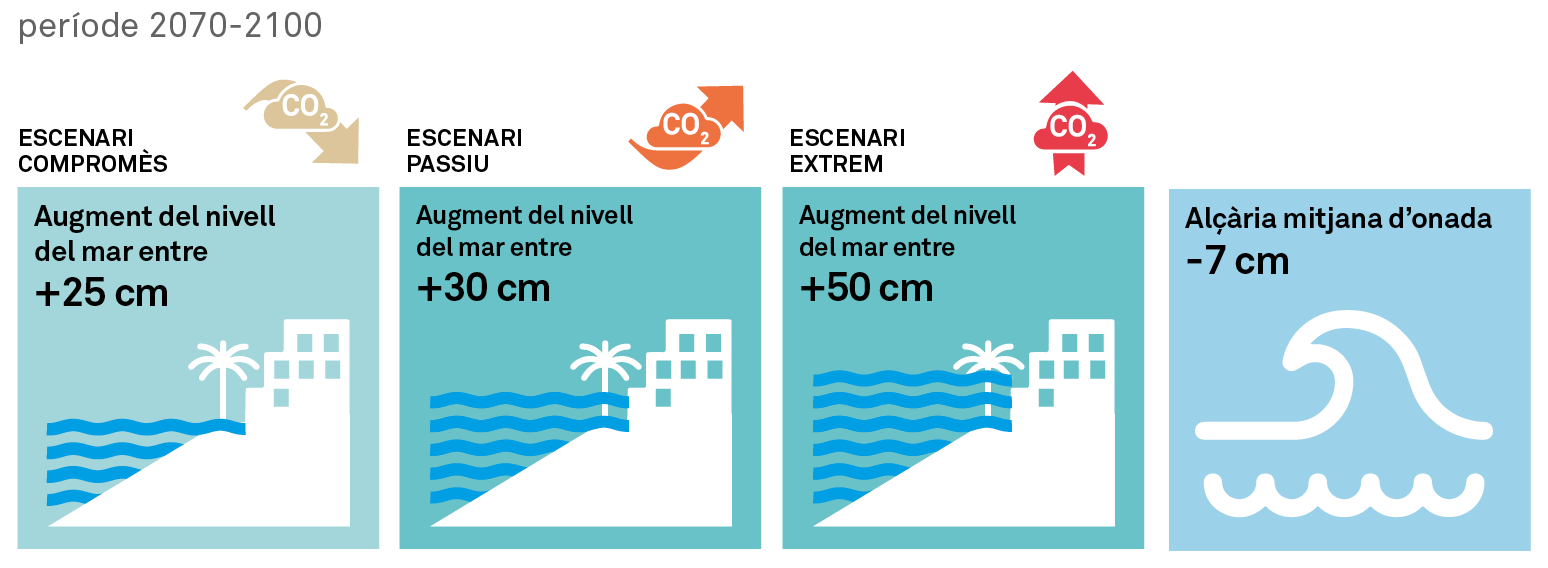
The sea variables studied include the rise in sea level and average wave height, measured and forecast thanks to the buoy in the Port of Barcelona. Although rises in sea level caused by climate change are much more noticeable in the oceans, the Mediterranean is also expected to be affected, with increases of +25 cm by the end of the century in the compromise scenario and of an average of +30 cm in the 'business as usual' scenario, and with possible extremes of up to +50 cm.. Average wave height, in contrast, is expected to fall - most likely due to a greater number of anticyclones during the year - by around 5-10 cm by the end of the century.
Extreme variables
Extreme weather events, such as heat waves or torrential rain, will become more and more common
The extreme variables under analysis are very different from climate values in that they don't use average values over long periods (usually 30 years) but instead relate to short (lasting between minutes and days), one-off events with very different values from those that are normal for the local climate, and they usually result in catastrophic damage. These one-off events have been analysed using the most common return periods: T10 and T100. Return periods refer to the likelihood of an event of certain characteristics taking place within a given period. For example, torrential rain with a return period of 100 years (T100) means that the amount of rain falling in only one day for this return period is only statistically likely to be matched or exceeded once every 100 years, although this does not mean that there cannot be two equally or more intense storms than the 100-year storm in two consecutive years.
Below is an analysis of the extreme climate phenomena under consideration: maximum temperature, heat waves, torrential rain, extreme snowfall, warm and cold days, tropical nights, frost days and extreme waves.
TEMPERATURA
Various extreme variables for temperature have been analysed. These are described below, with the expected changes.
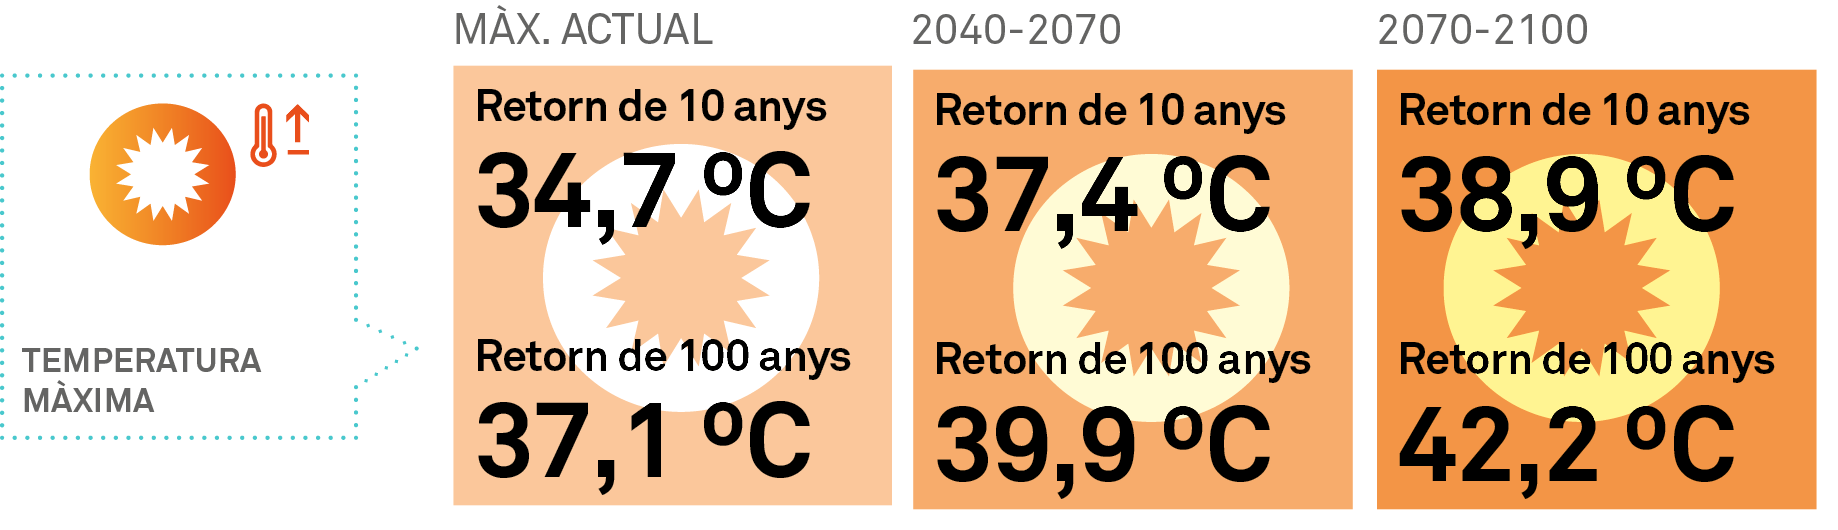
MAXIMUM TEMPERATURE
This is the highest annual temperature reached on a specific day. These values are expected to soar in the future, as annual maximums are linked to average temperature trends. Thus, if a maximum temperature of 34.7 °C is statistically currently reached once every ten years, this maximum temperature will increase by almost 3 °C to 37.4 °C by the middle of the century and could reach almost 40 °C by the end of the century. In other words, by the end of the century we would reach 40 °C once every ten years.
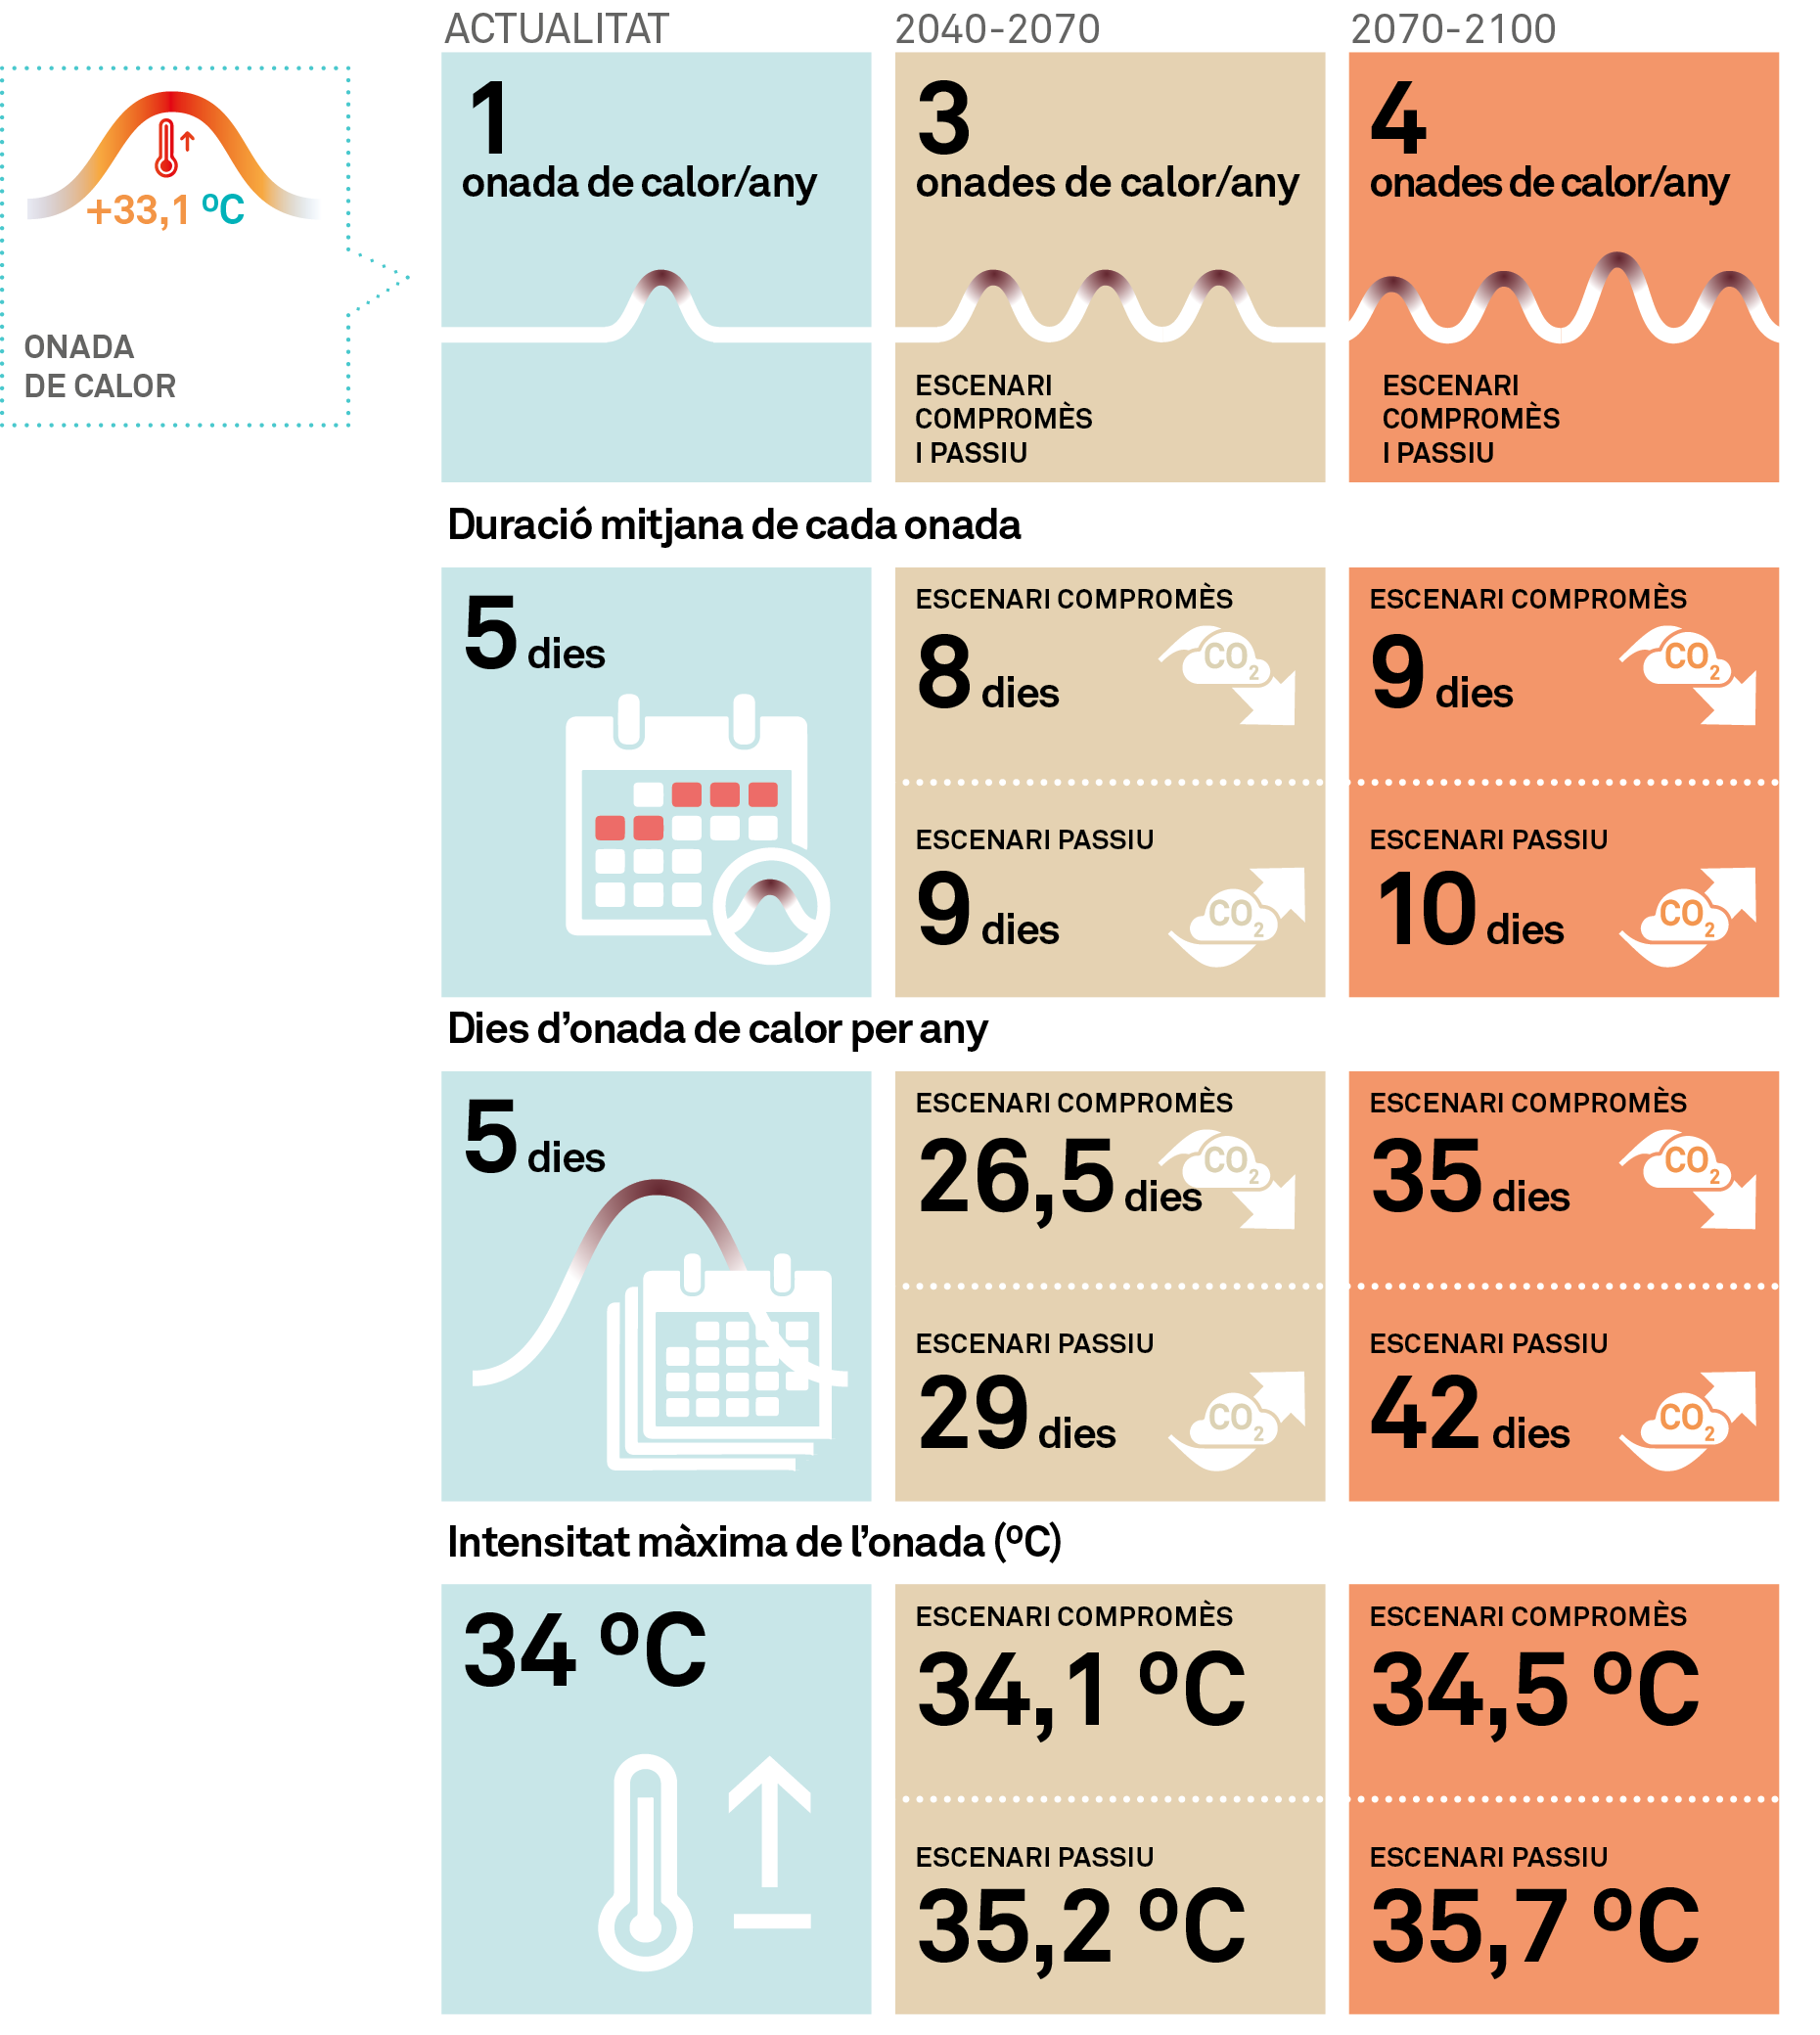
HEAT WAVES
Heat waves are defined as a period of at least three consecutive days in which the highest temperature exceeds the 98th percentile of all the maximum temperatures in a given region between June and August. A drastic increase in all heat wave-related figures – always using the definition of heat wave based on the current climate – is expected. These results are consistent with a future scenario in which average temperatures will increase significantly. Details of the features characterising heat waves, and their changes, are provided below.
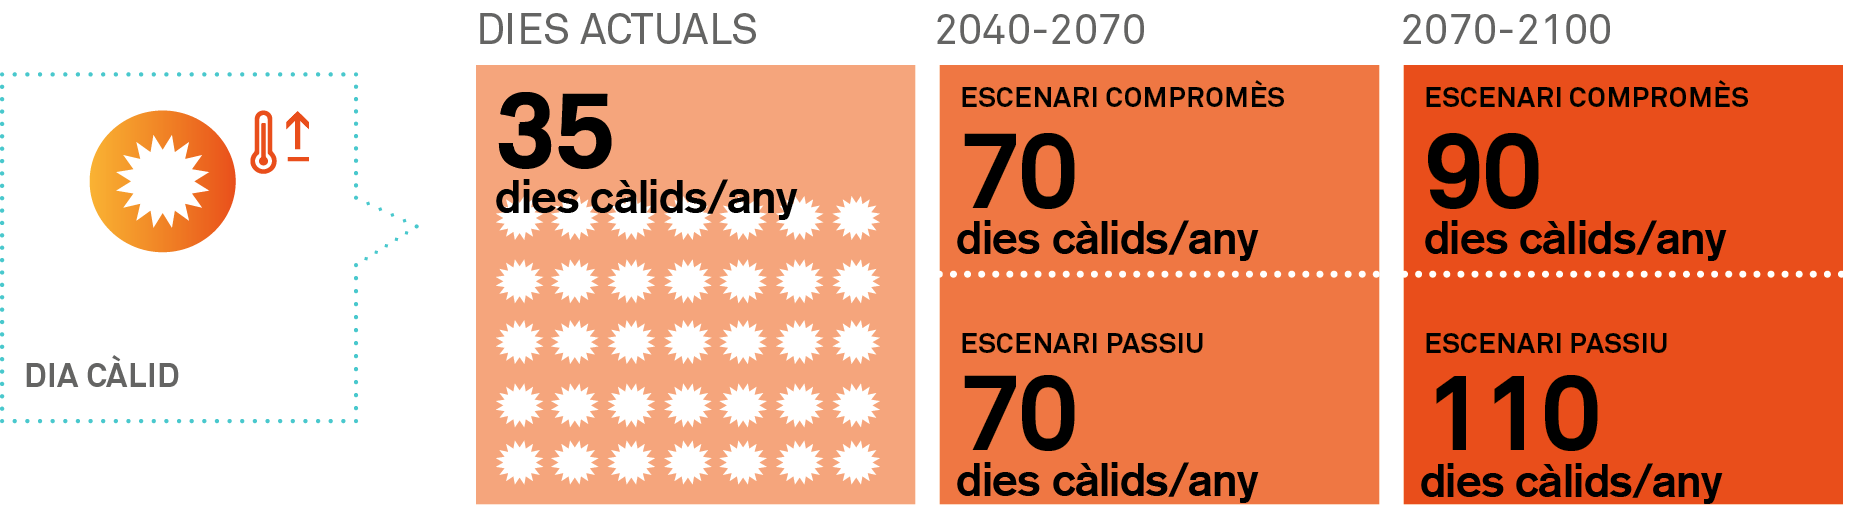
WARM DAYS
Warm days are defined as those in which the maximum temperature exceeds the 90th percentile of the maximum temperatures for the period. A huge increase in the number of warm days – with the definition based on the current climate – is expected under both RCPs, with the number doubling by the middle of the century and tripling by the end of it.
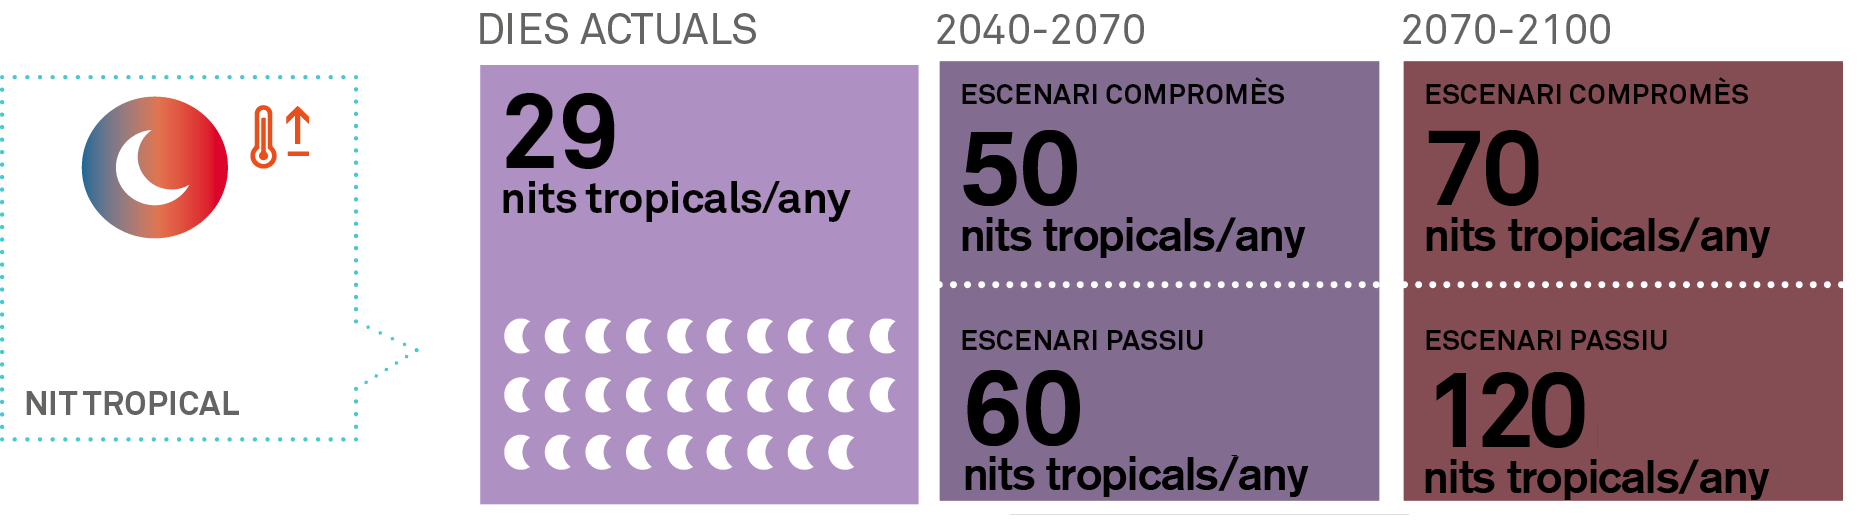
TROPICAL NIGHTS
Tropical nights are defined as those in which the minimum temperature for the night remains at 20 °C or above. A huge increase in the number of tropical nights is expected under both RCPs, with the number doubling by the middle of the century and quadrupling by its end in the 'business as usual' scenario – all this using the values for the current climate.
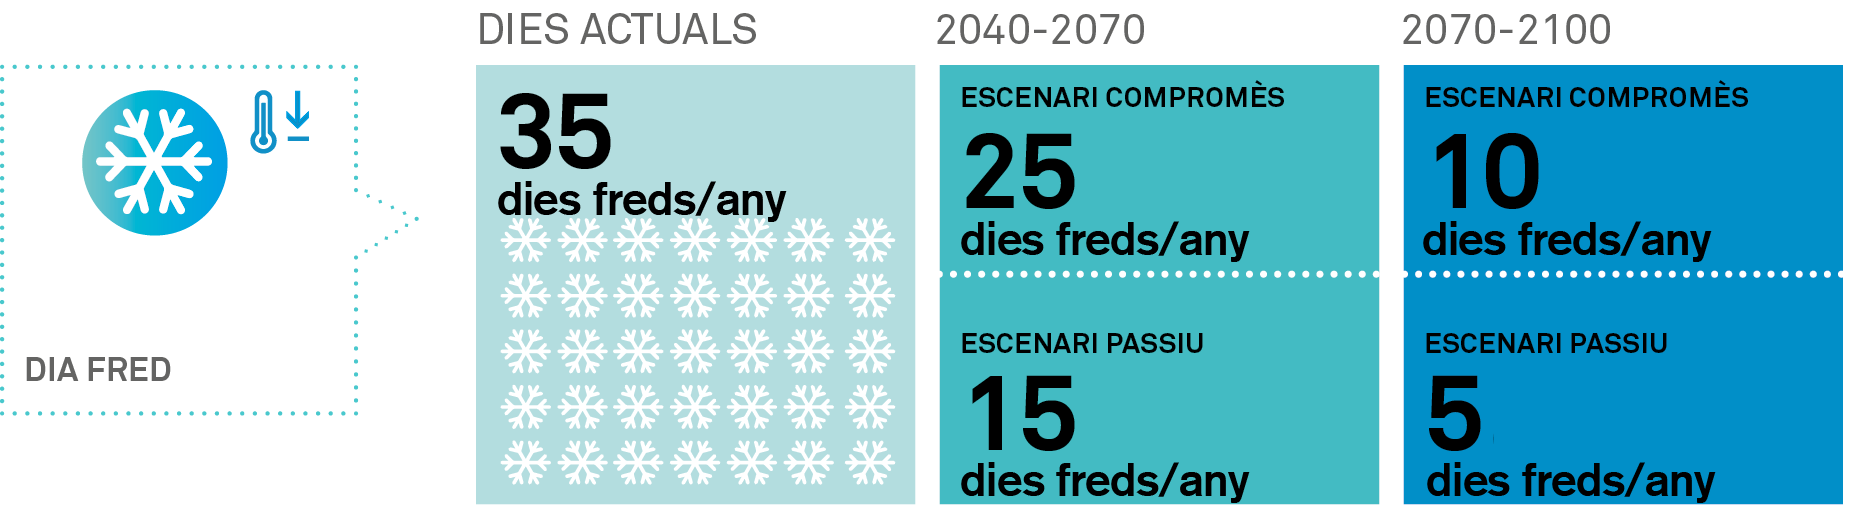
COLD DAYS
Cold days are defined as those in which the maximum temperature does not exceed the 10th percentile of the maximum temperatures for the period. A very significant reduction in the number of cold days is expected under both RCPs, with a drop of between 30% by the middle of the century in the most optimistic scenario and 85% by the end of the century in the worst case scenario.
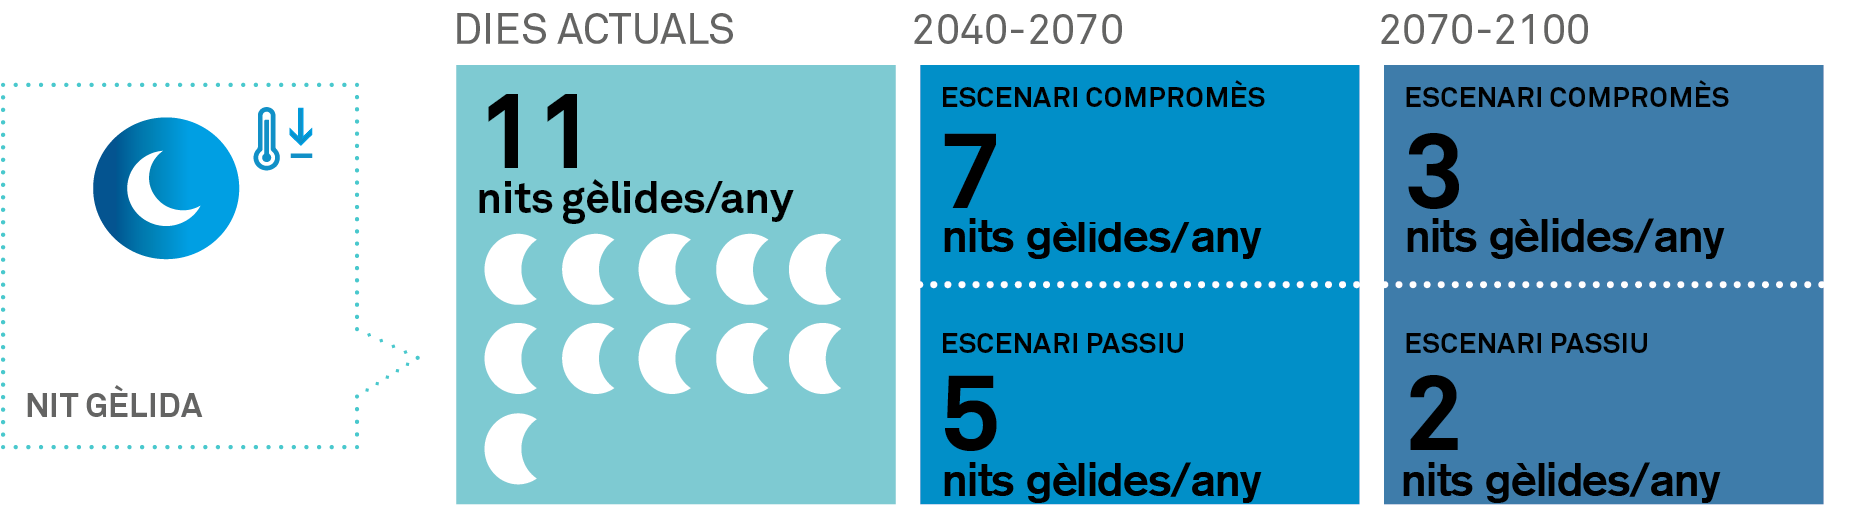
FROST DAYS
Frost days are those in which the minimum temperature drops below 0 °C. There is a notable decrease in the number of frost days under both RCPs, with their number halving by the middle of the century and practically disappearing by the end of it.
PRECIPITATION
As regards precipitation-related extreme phenomena, future changes to torrential precipitation events and heavy snowfall have been obtained.
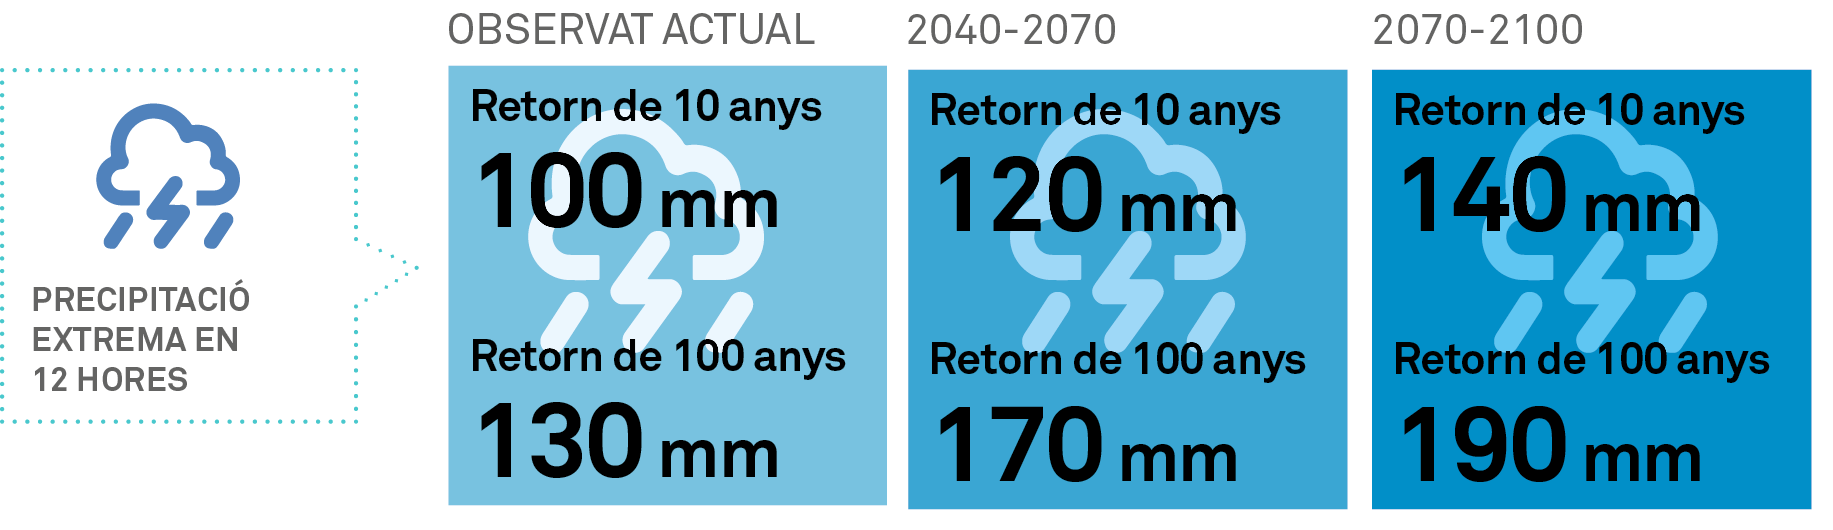
EXTREME PRECIPITATION IN 12 HOURS
Total precipitation, usually torrential, falling in Barcelona within 12 hours. The difference in values is shown here. Although no changes to average precipitation are expected, the intensity of extreme precipitation is expected to rise significantly: between 20% and 30% by the middle of the century, and between 40% and 50% by the end of it. The models reveal more irregular rainfall, with less frequent but much more intense rain events.
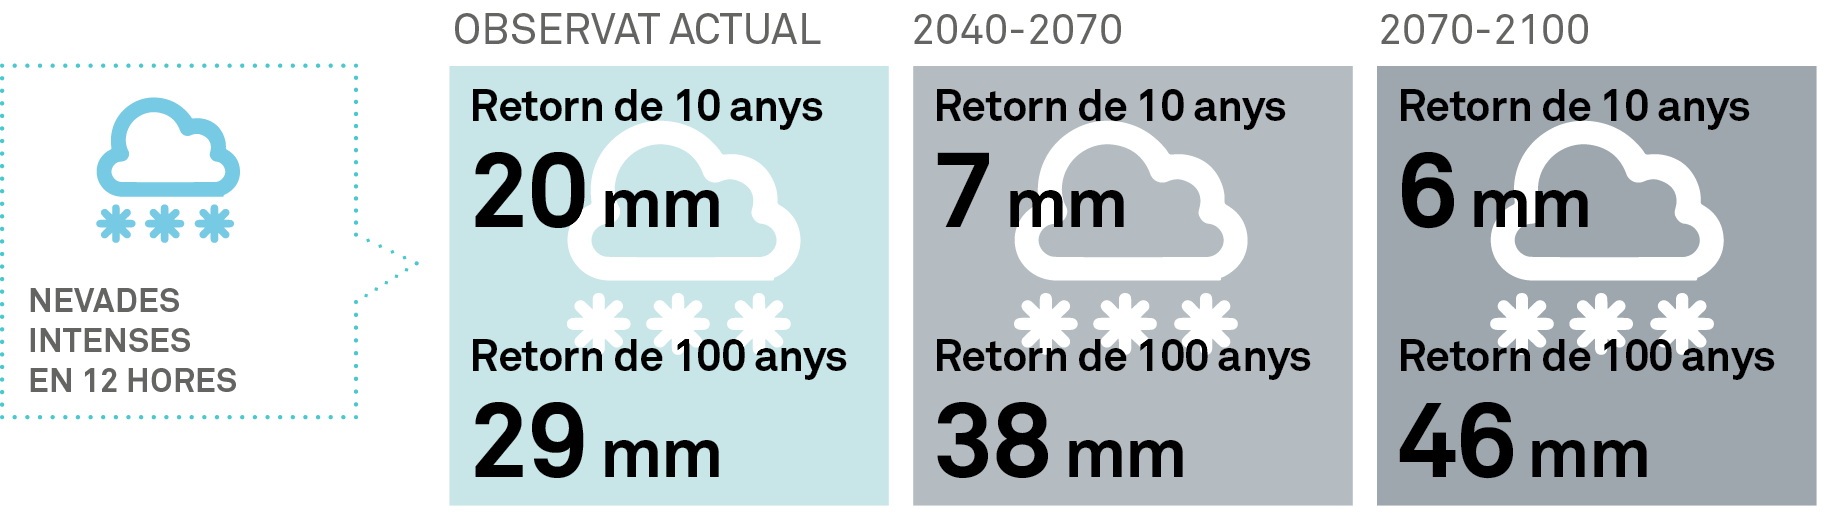
INTENSIVE SNOWFALL WITHIN 12 HOURS
Although snow in the Barcelona area is not a rare event, it is not frequent either, and it is generally a one-off occurrence. Due to the city's location, dry air and cold from Siberia can collide with the Mediterranean humidity, although this does not often happen. When it does happen, the resulting snowfall is usually intense due to the city's close proximity to the sea, particularly in higher places such as the Fabra Observatory (411 metres above sea level), which is where all the data is collected. Snowfall on the coast tends to be much less significant. The more frequent snowfalls (those with a ten-year return period) are expected to become significantly rarer due to rising temperatures. On the other hand, snowfall events reaching almost half a metre of snow in extraordinary events are expected to increase significantly by the end of the century because, if the necessary conditions are met, a higher precipitable water content in the atmosphere is expected.
SEA VARIABLES
As to the sea variables studied, several variables involved in the impact of extreme meteorological events on the Catalan coast have been calculated. These are maximum wave height and meteorological tide (or storm surge).
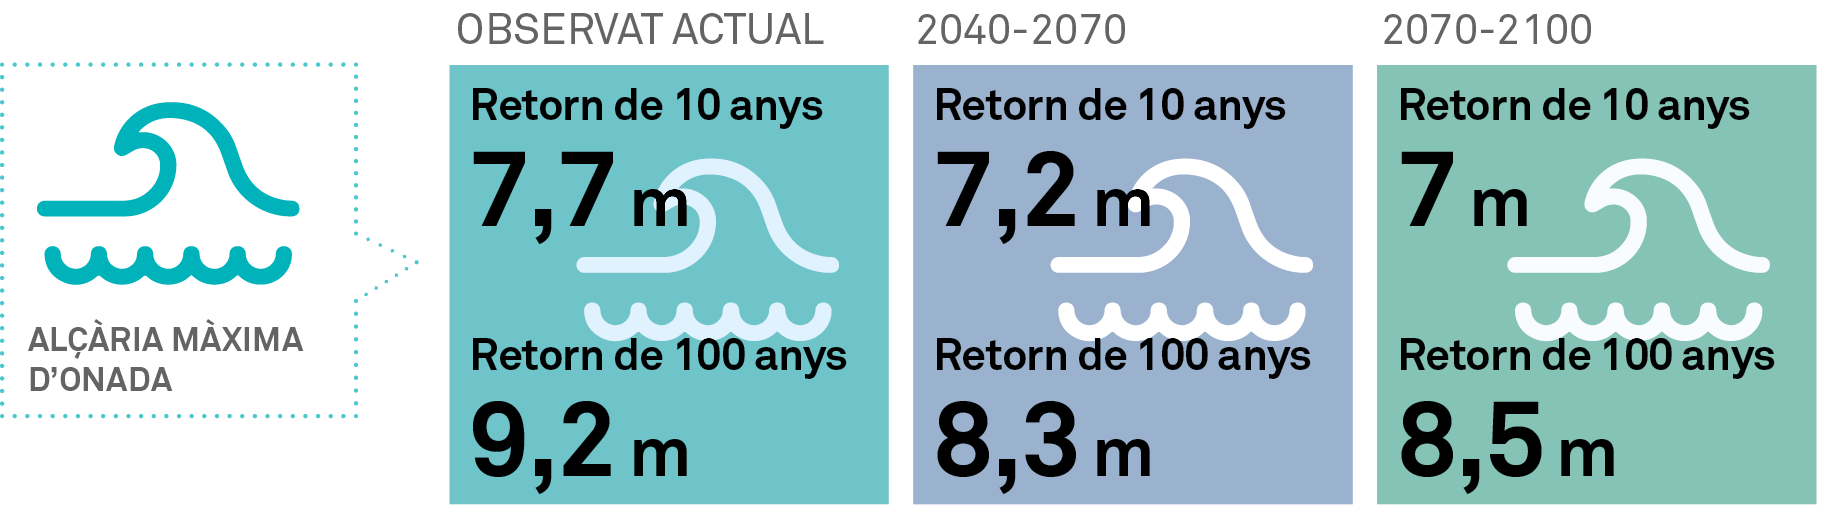
MAXIMUM WAVE HEIGHT
This variable describes the maximum expected value of the peak of a wave, defined as the height difference between its crest and trough points. These values are associated with extreme sea storms. In the case of Barcelona, the data relates to a single historical series, and only a small number of these events have been recorded (until 2018). As a result, the simulations made are not sufficiently consistent. In fact, at the time of writing, Storm Gloria (January 2020) shattered all previous records, but this significant event could not be included in the calculations. Using the data available when the climate study was carried out, the results suggest a decrease in maximum wave height of between half and almost one metre.
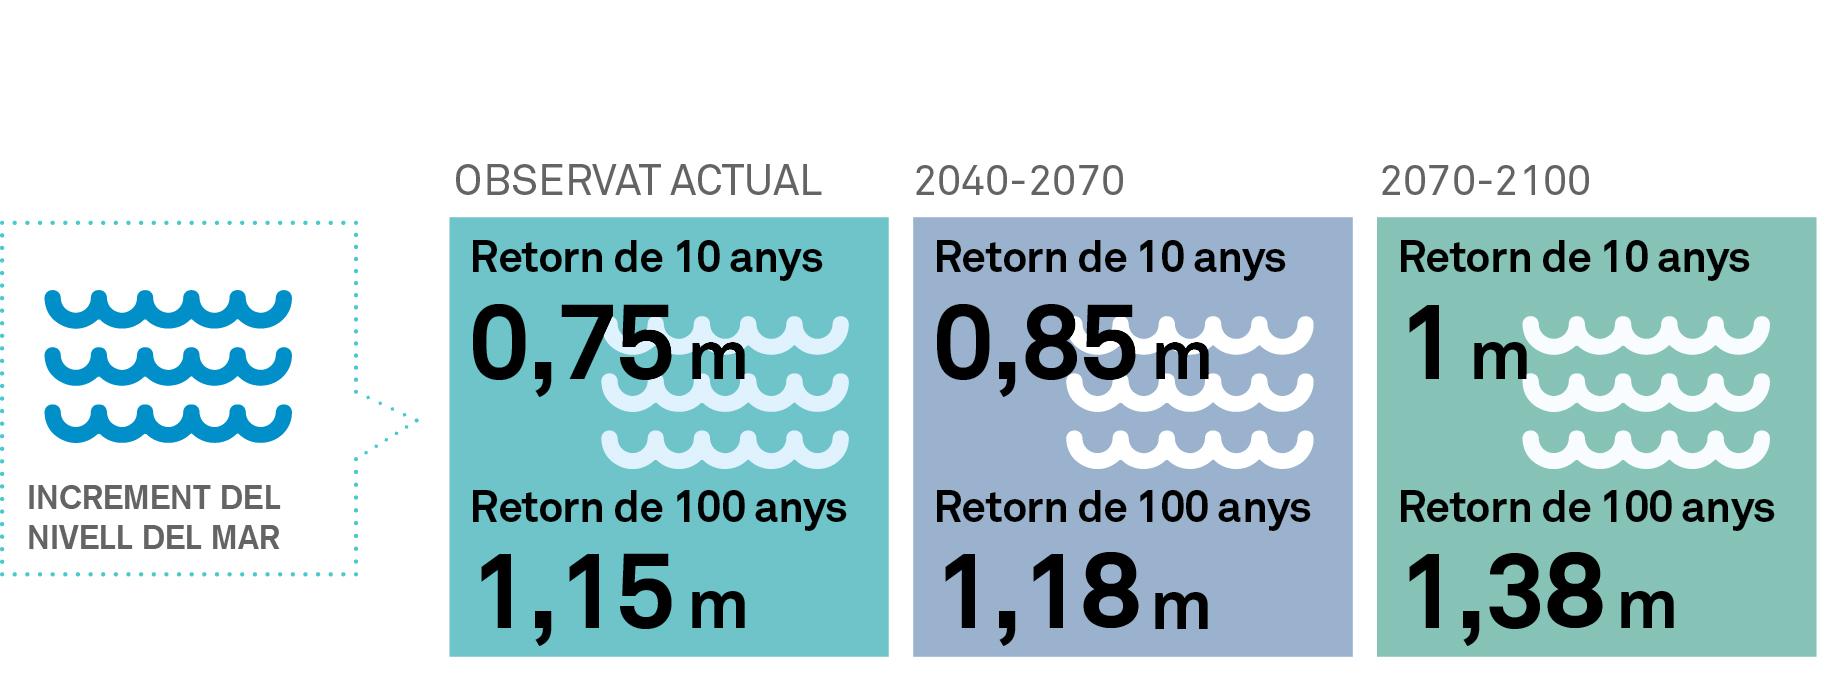
RISE IN SEA LEVEL
Meteorological tides o storm surges happen when a set of phenomena coincide and cause an abnormal change in sea level compared to what it would be with natural astronomical tides. These contributions are the result of persistent strong wind gusts and the expansion of the ocean surface due to low atmospheric pressure. If you add the meteorological tide to the astronomical tide, you obtain sea level values fluctuating between 10% and 15% above current values. This could entail an increase of 1.38 metres in the most pessimistic scenario studied (adding the maximum increase in average sea level). Below are the values observed and the changes expected for the future.
Comparison with other studies
New studies confirm the climate change trends and provide new information
The FIC has also compared the most extreme figures obtained in the RESCCUE project (for the 'business as usual' scenario or RCP8.5 by the end of the century, from 2071 to 2100) against the results of other previous studies or projects concerning the city of Barcelona. The aim was to produce an overview of the values expected for the future by various institutions with the aim of reinforcing each value, using different methods, in order to give the projections for the future a more solid basis.
TEMPERATURE
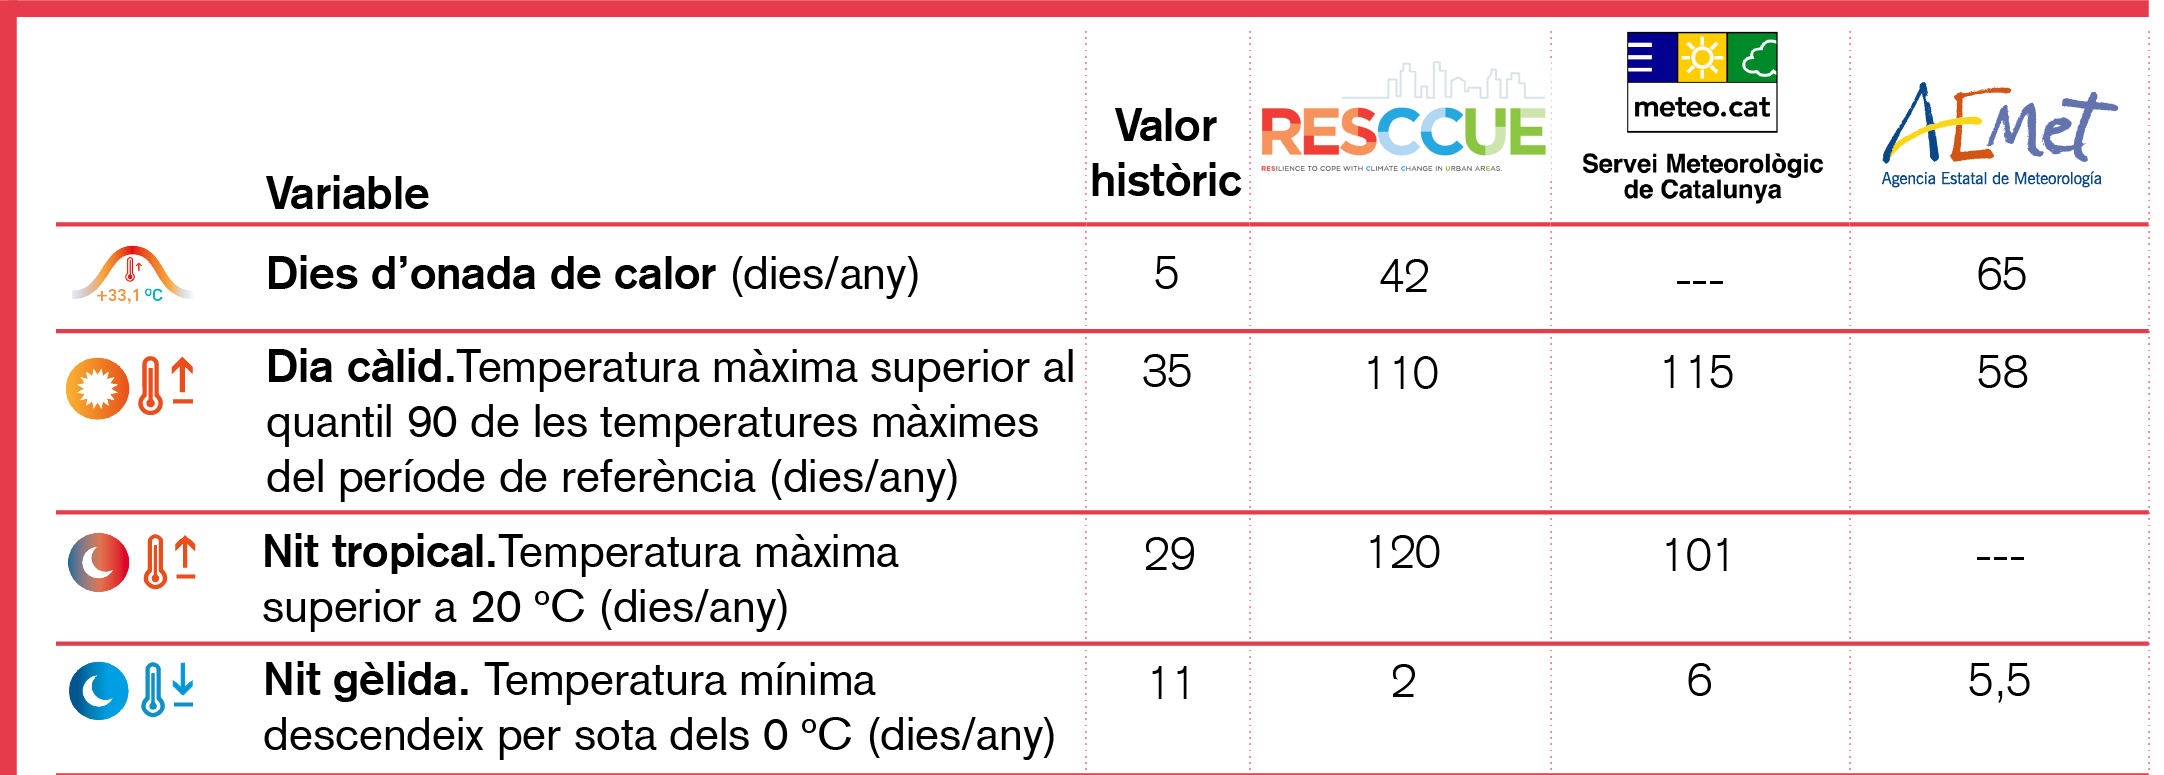
The results of the temperature-related variables are shown below, where available, for the values obtained by the RESCCUE project, the Catalan Meteorological Service (SMC, 2015) and the Spanish Meteorological Agency (AEMet, 2018).The figures reveal a sharp upward trend for temperatures, as well as very similar results between all the institutions.
PRECIPITATION
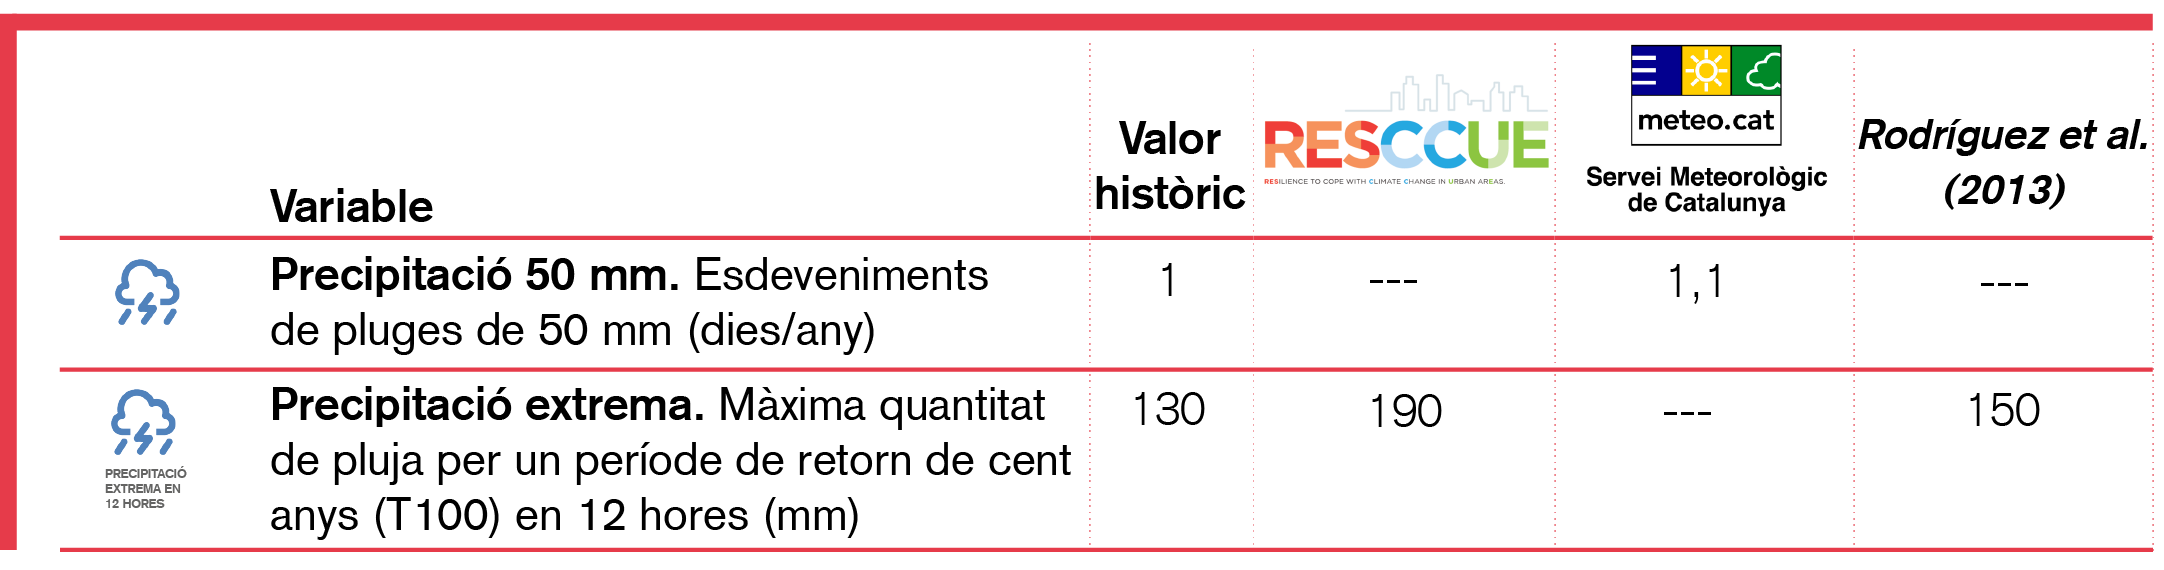
Comparing precipitation values has proved more complicated. Unlike the RESCCUE project, the SMC's study was based on variations in 50 mm events, while the RESCCUE project used return periods. The two types of value are displayed in the same way.
The figures showing an increase in extreme precipitation expected in Barcelona are fairly consistent between the RESCCUE project and the study conducted in 2013 by Rodríguez et al. (this study was carried out within the framework of the CORFU project, under which precipitation curves for the city of Barcelona were developed and prepared). The SMC's results suffer from great uncertainty, possibly as a result of using only three models.
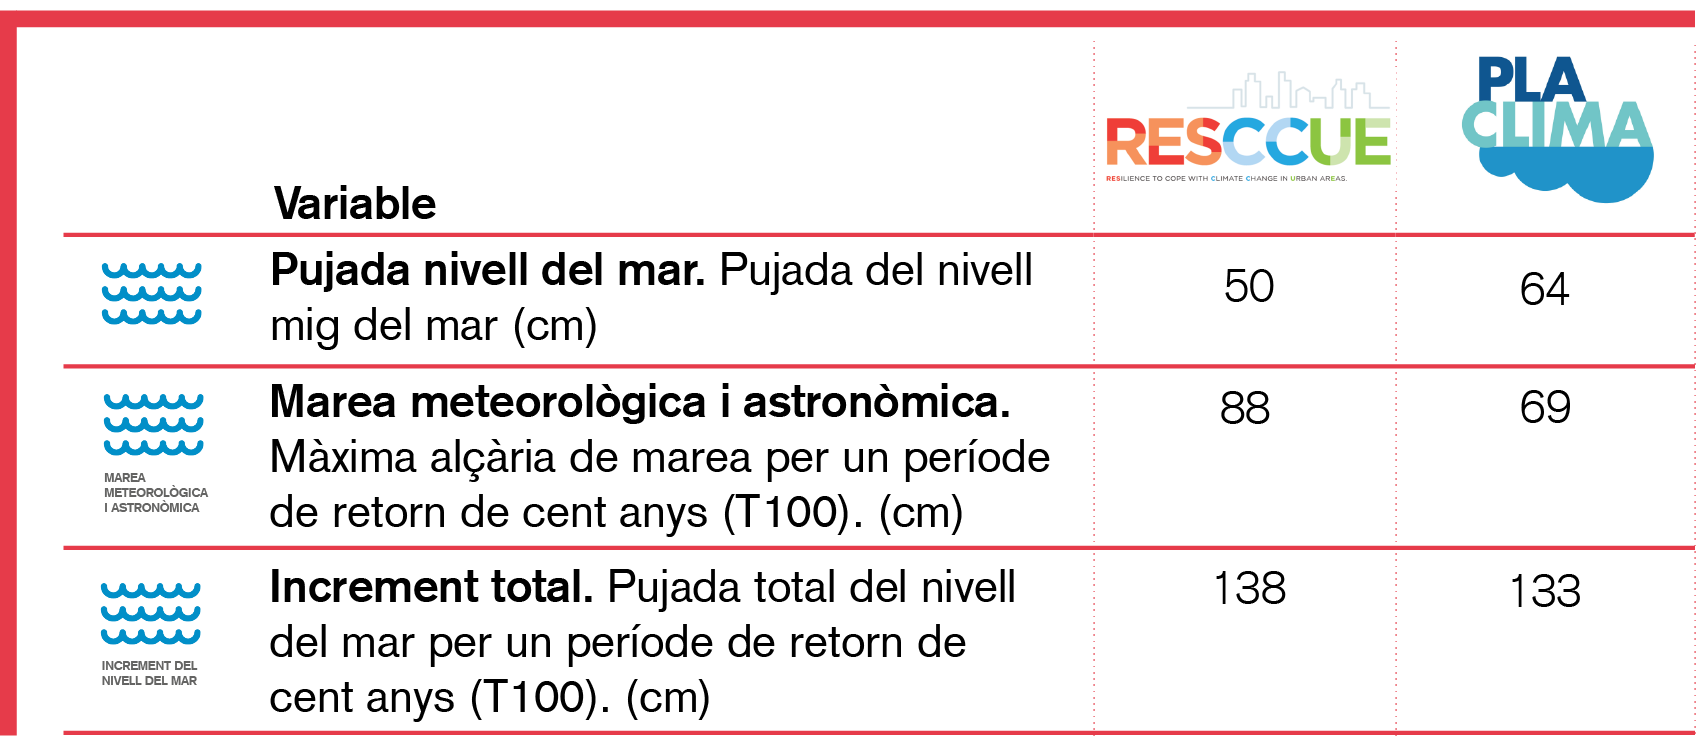
SEA VARIABLES
Finally, we have provided a comparison of the future values expected for the rise in sea level due to both the rise in average sea level and the contribution of meteorological and astronomical tides. In spite of slight discrepancies regarding the exact contribution made by each phenomenon, the total extent to which the sea level is expected to rise is almost exactly the same in both cases, and very significant: almost 1.5 metres above the current level in Barcelona's coastal areas..
To consult further information on the project RESCCUE:Visit RESCCUE