Introduction
Before solid waste is transported to the rubbish dump, the collection process in big cities begins with the regular collection of domestic waste by the municipal service, through the use of street containers. When urban flooding occurs, these containers may become unstable, thereby allowing the rubbish to fall out and contaminate the floodwater.
The study considers that container stability may be compromised when the hydrodynamic variables, the depth and speed of the water, rise above a certain threshold. These variables have been combined and compared with the sliding and toppling stability stability thresholds for the various containers. A GIS analysis then shows the location of potentially unstable containers in the city, when they are exposed to various flooding frequencies.
There are a total of 27,134 containers in Barcelona, which can be classified according to the waste fraction they contain: other (44%), organic (22%), paper and cardboard (12%), packaging (11%) and glass (11%); by their volume in litres (3,200, 3,000, 2,400, 2,200 and 1,800) or by the way they are unloaded: lateral (62%), bilateral (25%), rear (12%) and underground (1%). Due to the lower proportion of rear-load and underground containers compared to those of a lateral and bilateral-load type, only the first sort are taken into account in this study, which accounts for 87% of the total number of containers. Lastly, a container can be more or less vulnerable to flooding depending on its volume, waste fraction and how full it is. The study considers three scenarios: empty, half-full and completely-full containers.
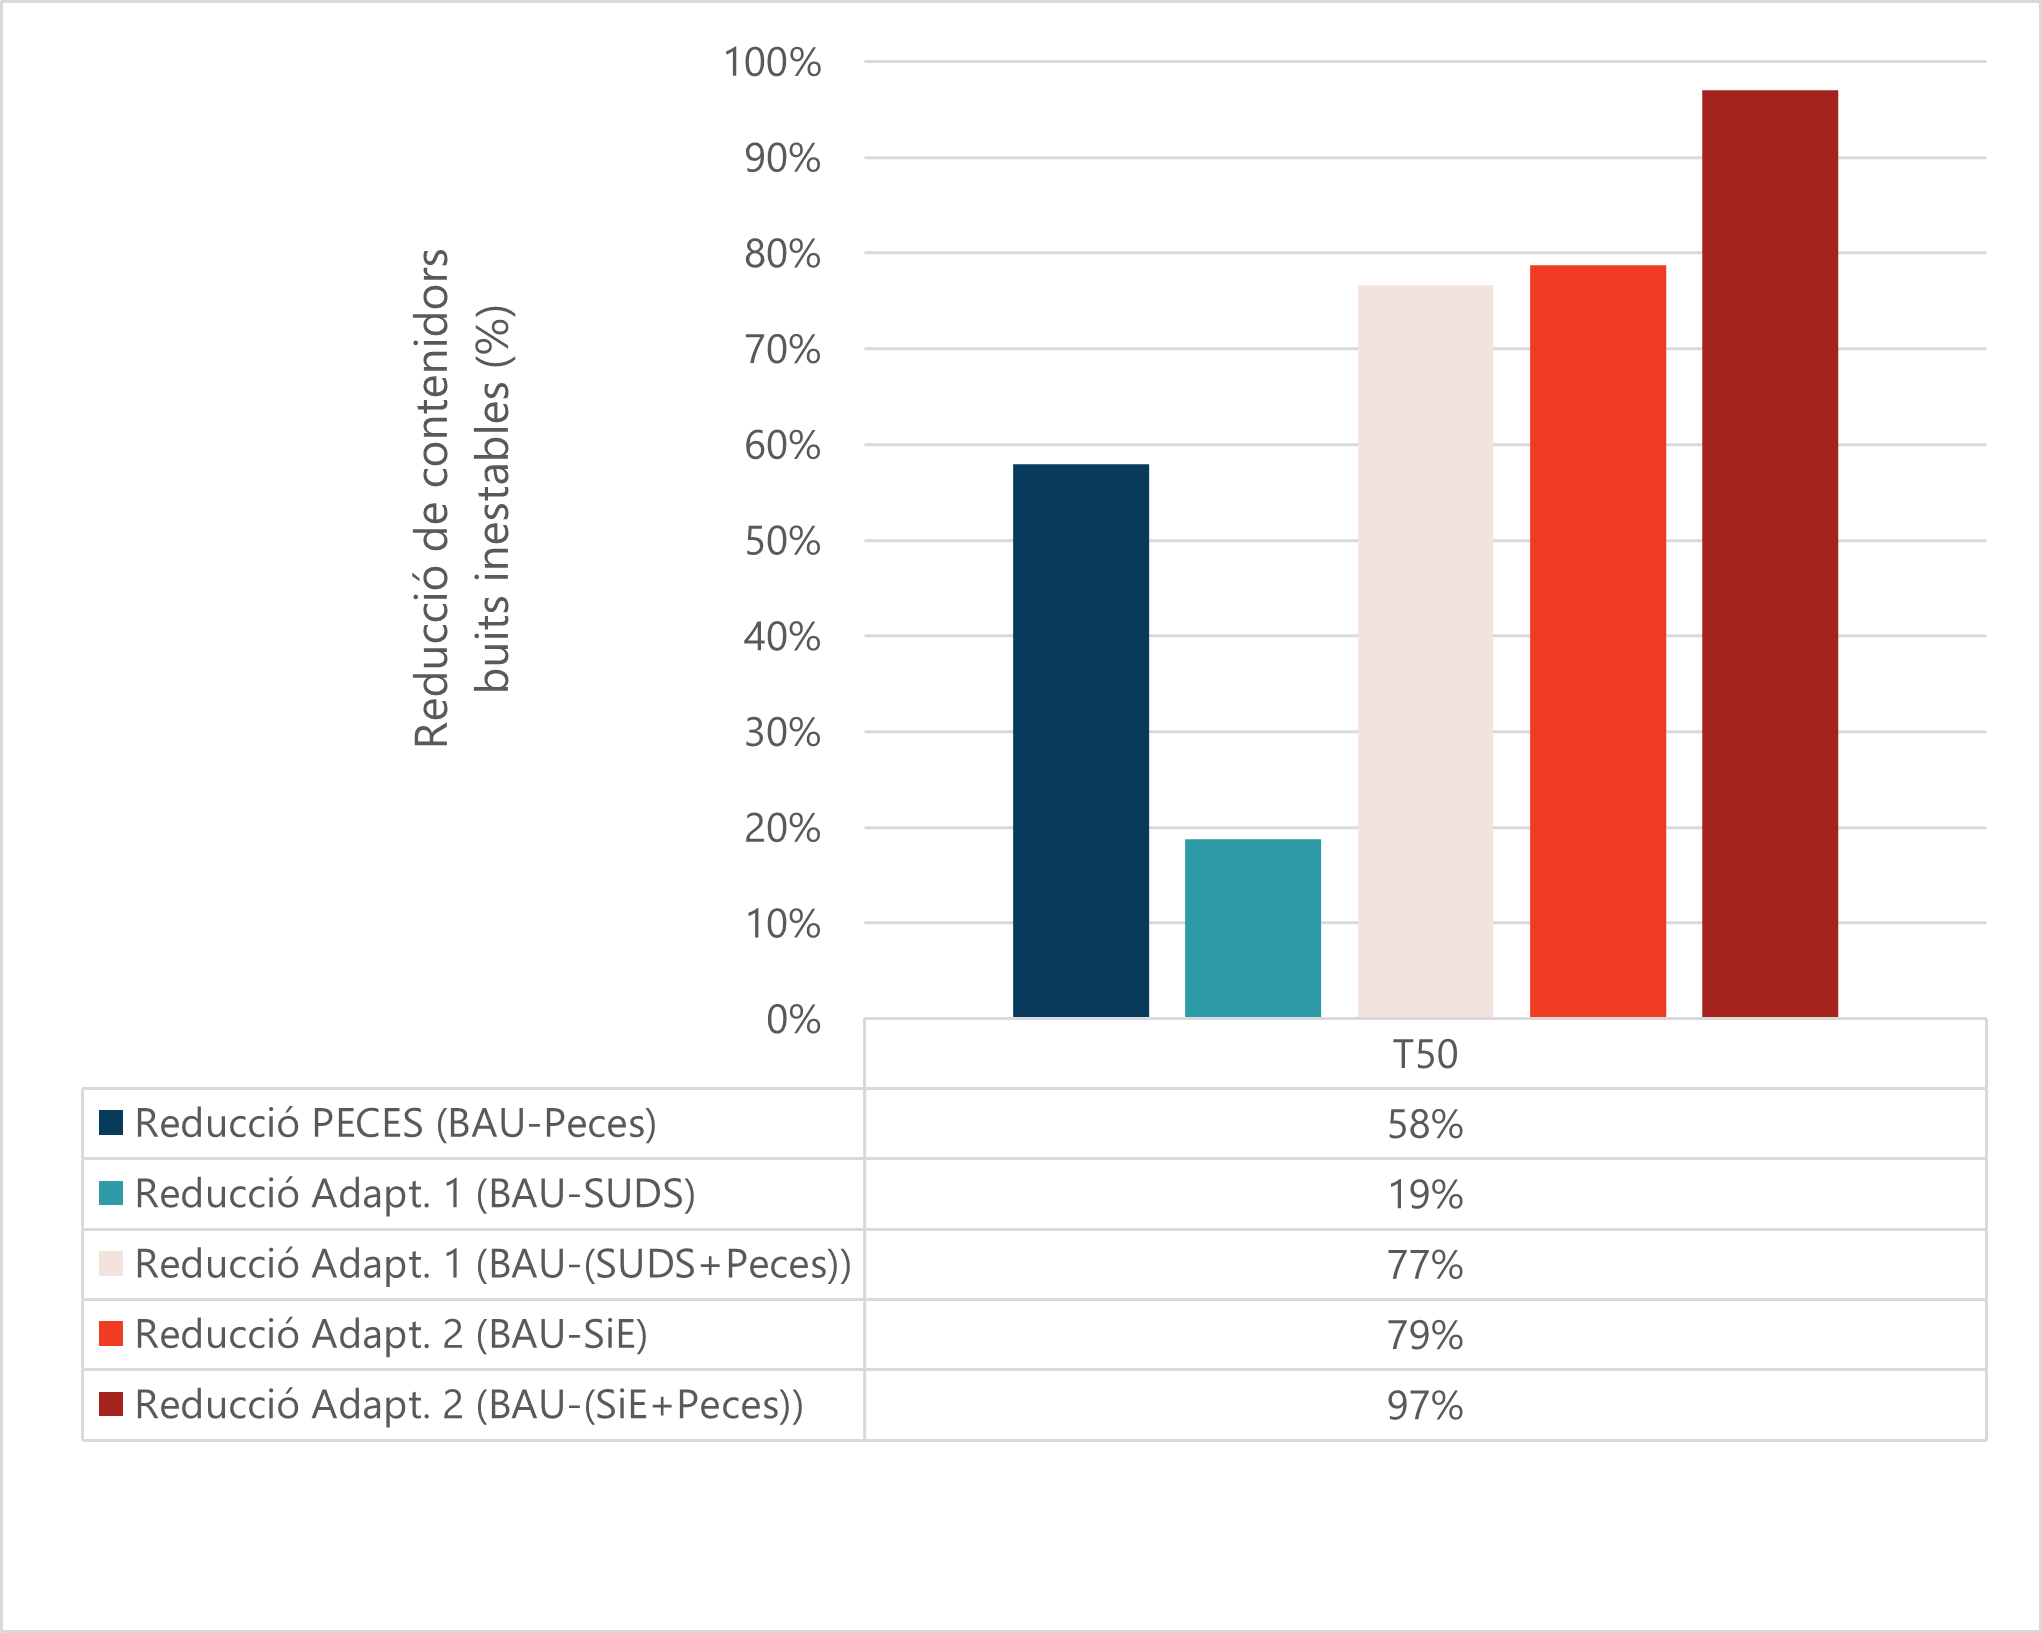
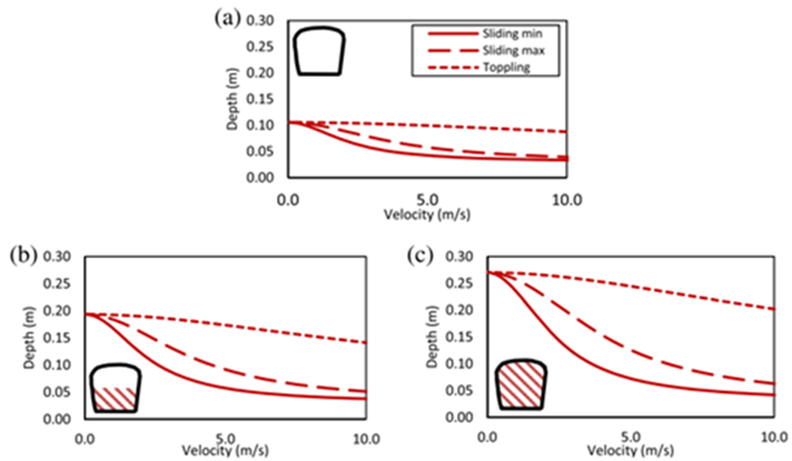
Container-stability functions (Figure 1) have been developed based on an analysis of the forces that act on a container, establishing balance conditions for the various types of instability (i.e. sliding, toppling and floating). These functions depend on the speed and depth (flow) of the water. Furthermore, the characteristics of each container (volume, size, waste fraction) determine the nature of each function. The obtained stability thresholds are used to analyse the potential behaviour of the containers during rainwater flooding episodes in Barcelona, designed for historic periods and low return periods, i.e. between 1, 10 and 50 years. Above T50, expected impacts do not increase significantly, and therefore this return period is considered to be sufficiently adverse.
Risk areas
The risks relating to container stability can be summarised as collisions with other urban elements or properties, additional efforts and expense to put them back into position, water contamination, pedestrian safety, traffic disruption, possible blockages in the drainage system and an increased probability of cascade effects from flooding.
Overturned containers release their rubbish, which is carried away by the flood water and may cause greater blockage in a narrow street, create an enclosed basin with no outlet for run-off and exacerbate the effects of flooding. Meanwhile, drain grilles may get blocked with solid waste if they fall out of containers which have become unstable, with negative effects on the drainage system. Furthermore, a lack of container stability may cause direct effects, such as the interruption of waste collection, impacts on people or other elements and cascade effects, such as traffic disruption.
The main unknown factor in this study is how full each container may be. Although three different scenarios in regard to container content are taken into account, the fact that they fill up equally at the same time involves a major unknown factor.
Risk assessment is based on the containers exposed to a certain level of danger, in terms of water depth and speed, identifying high-risk areas where a large number of containers are expected to lose stability; those high-risk areas coincide with the critical points identified in the chapter on urban flooding..
The general maps show the containers that may lose stability, according to the various types of instability (floating, slidding and toppling) and based on the various content scenarios (empty, half-full and completely full). Below are the maps for a high-risk scenario: empty containers in a 50-year return period for current and future scenarios.
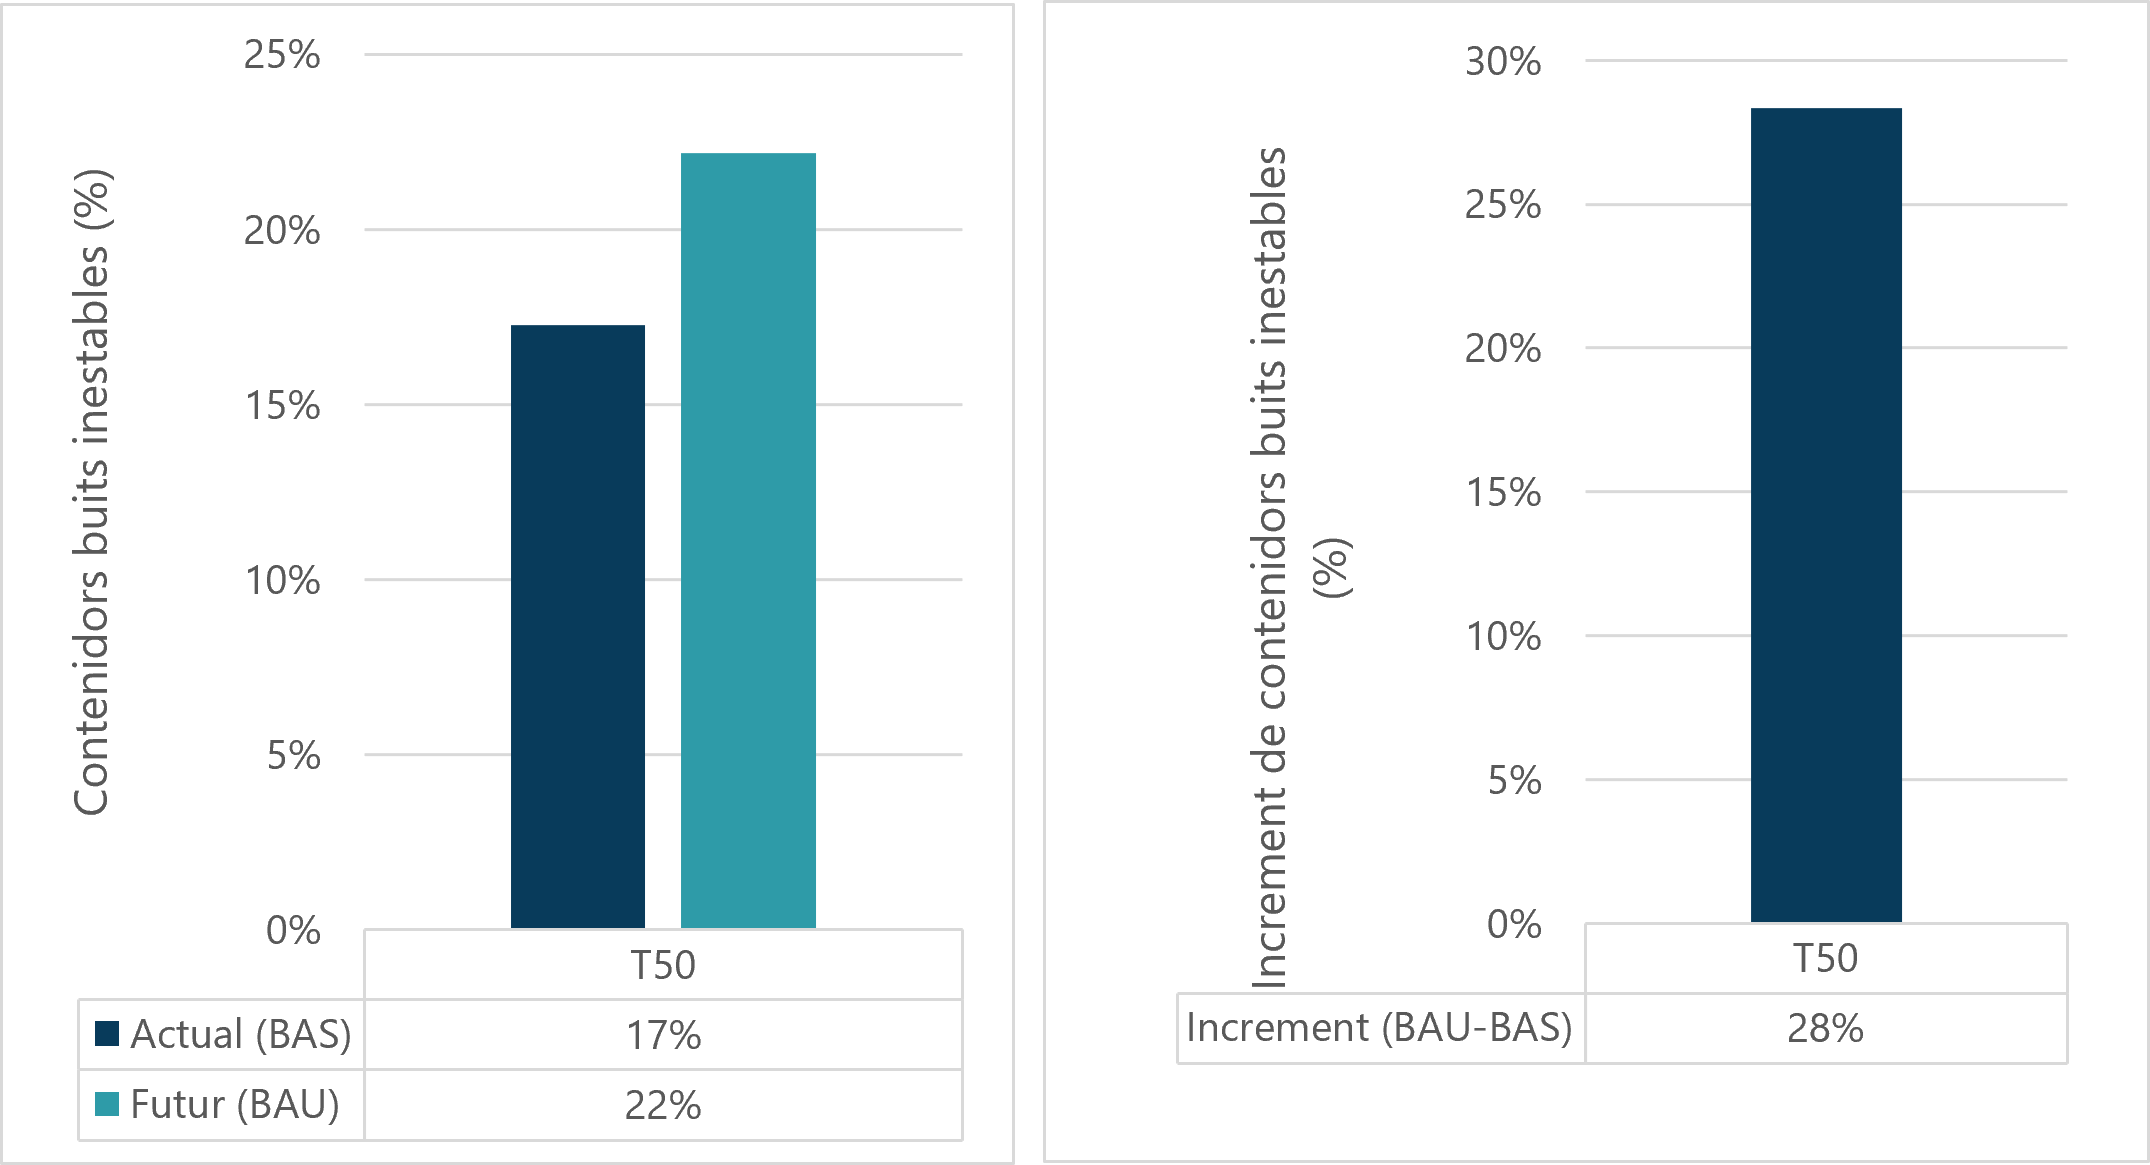
The analysis has shown that with current rainfall corresponding to a T50 return period, 17% of all containers in the city lose their stability and that this number could increase to 22% under future rainfall conditions, which means an increase of 28% in the number of empty containers that are potentially unstable as a result of climate change. This increase means the number of unstable containers rises from 3,000 to 4,000.