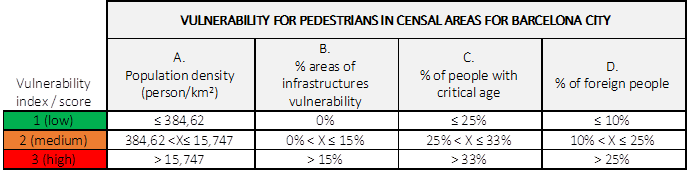
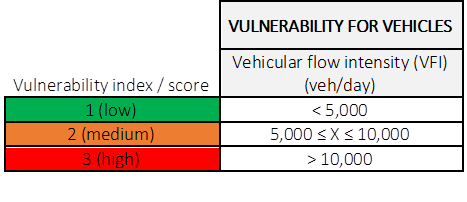
Back to top

Introduction


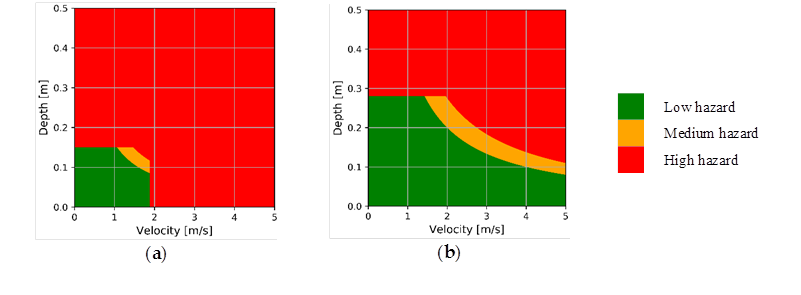
This study on how flooding affects the stability of pedestrians and vehicles is based on the results of the 1D/2D urban drainage model, where velocity and water depth are characterised as the main hydraulic variables that affect pedestrians’ and vehicles’ stability in the event of urban flooding from rainfall. The figure below shows how flow velocity and water depth determine the degree of hazard according to the thresholds proposed for the study, for pedestrians (a) and for vehicles (b):


Figure 1. Hazard matrix for pedestrians (a) and vehicles (b) according to the hydraulic variables examined: flow velocity and water depth.

Hazard


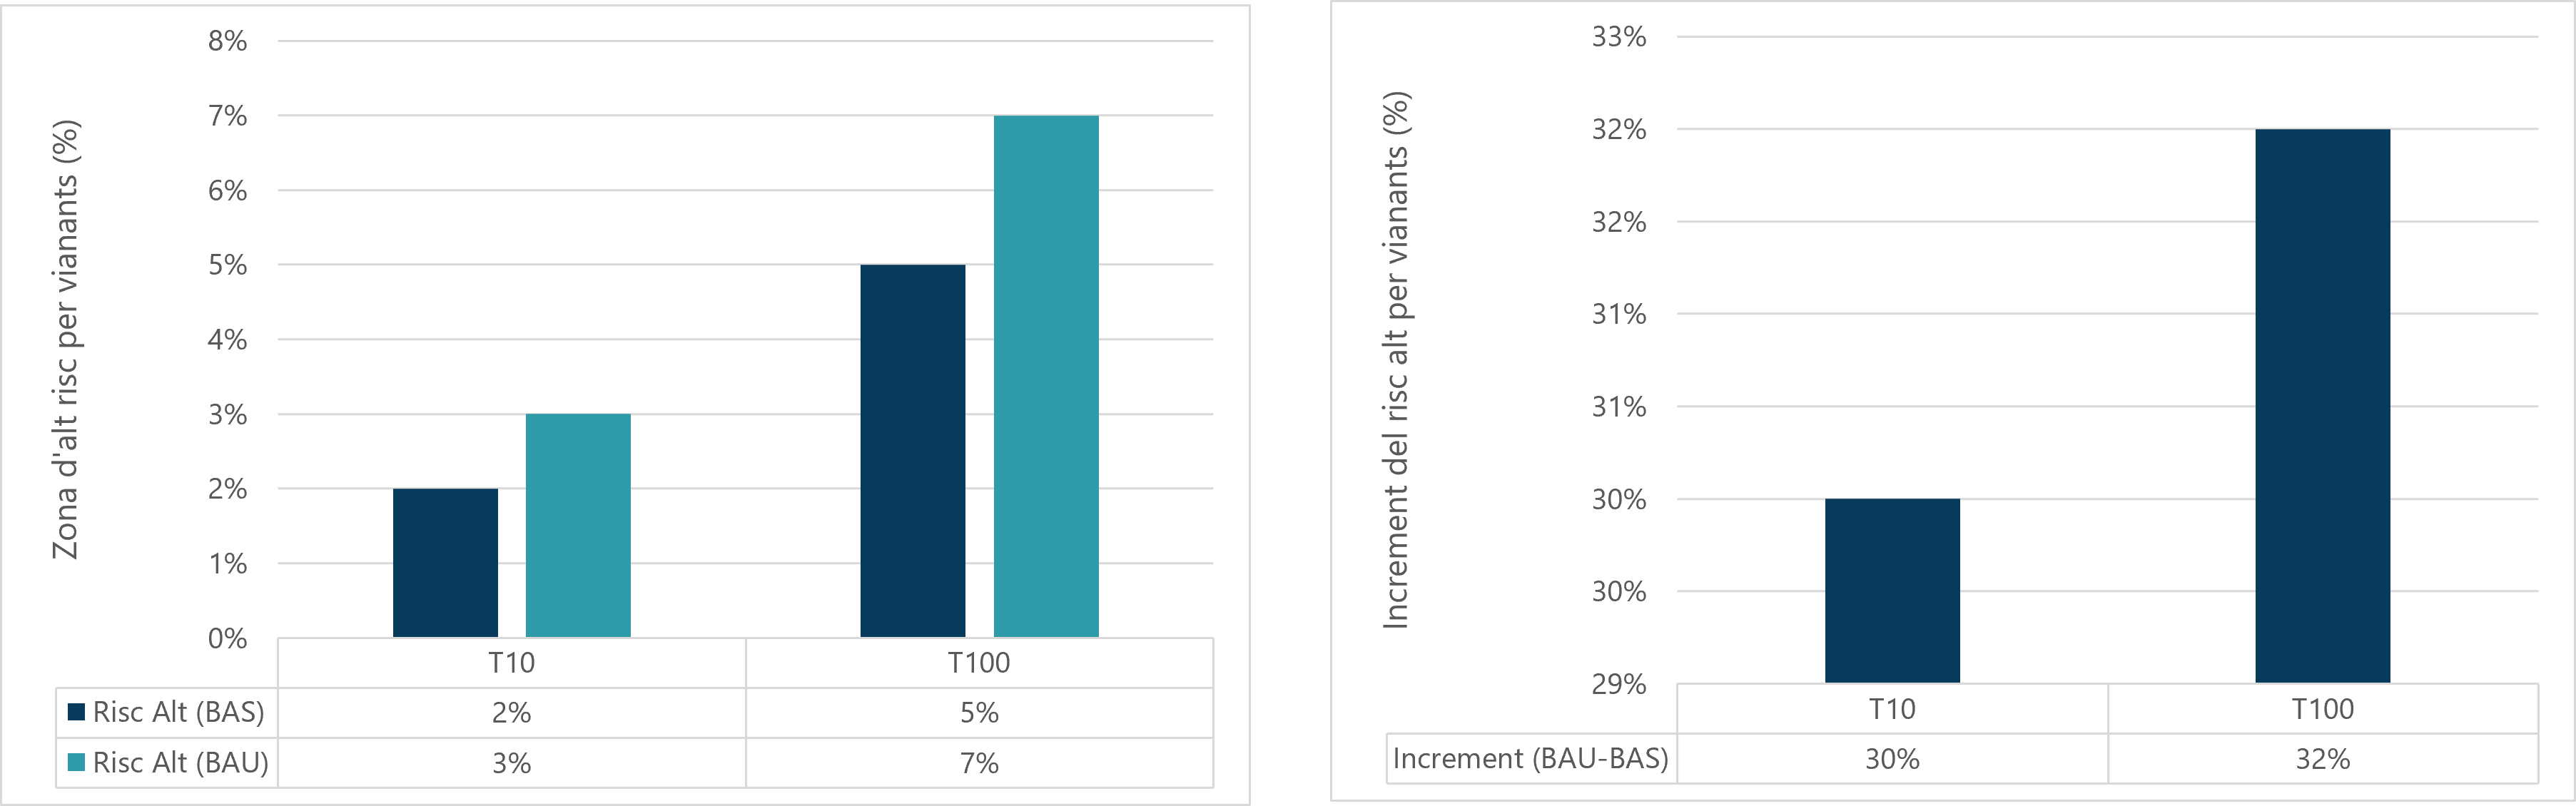
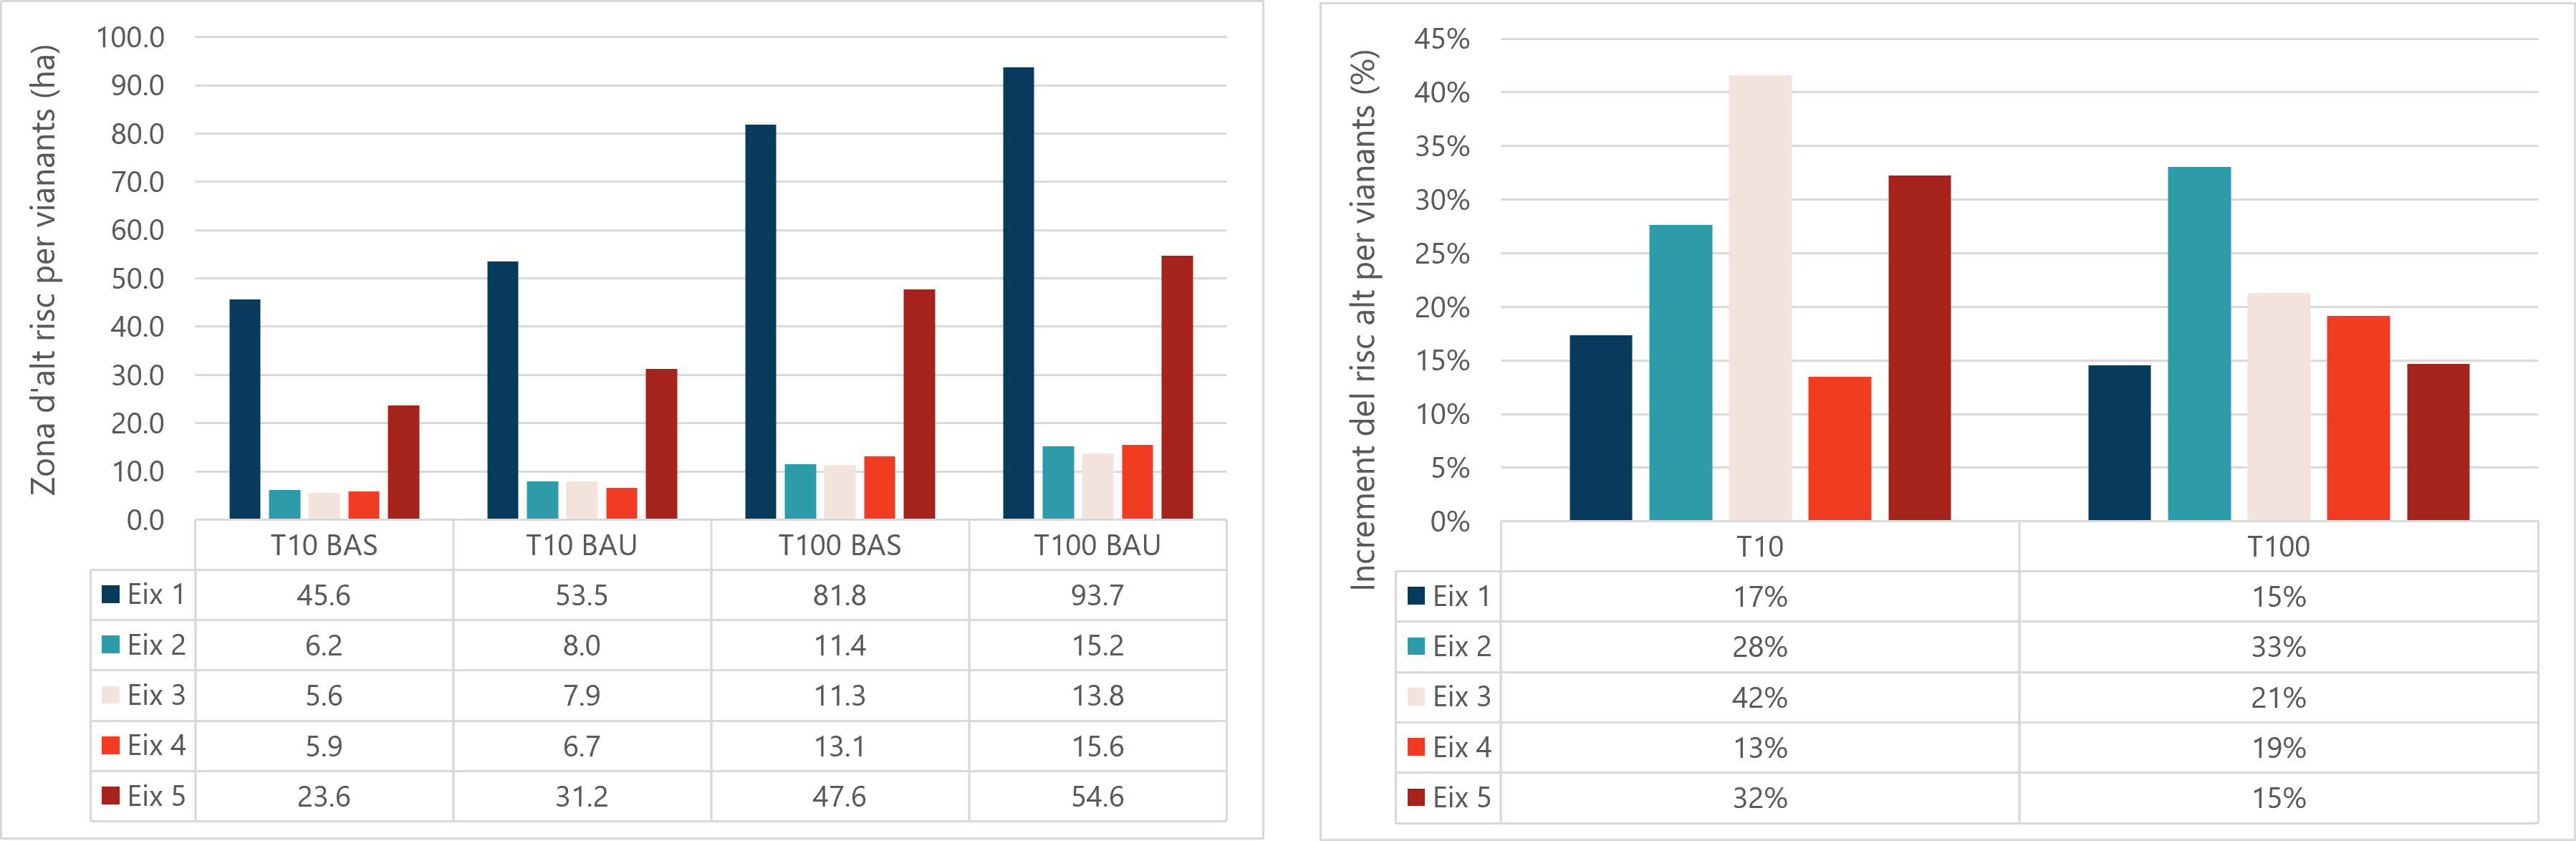
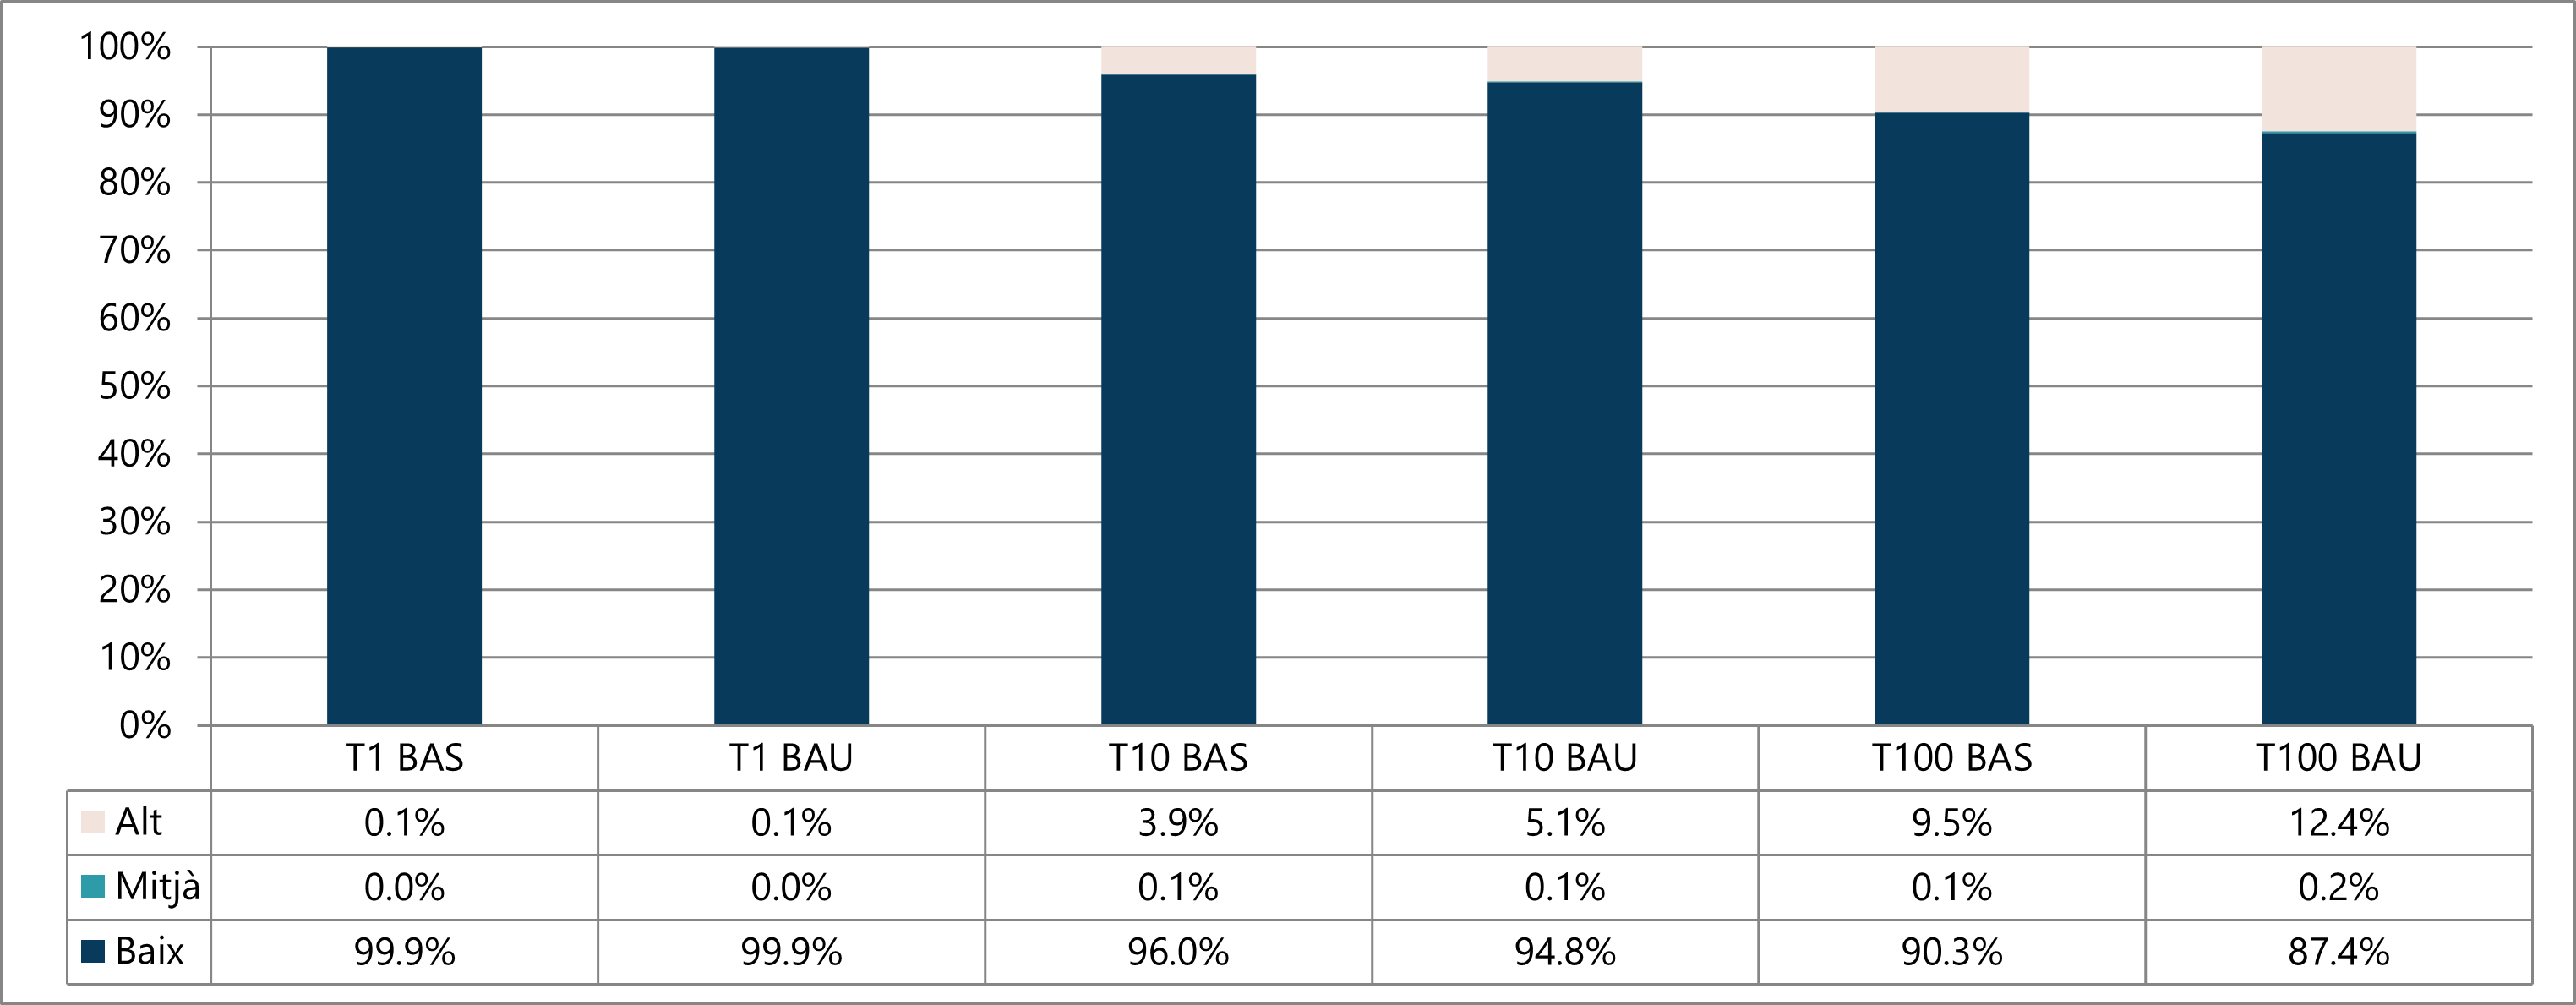
The hazard maps represent the probability of a pedestrian losing stability, falling and being swept away by the water flow. High-hazard zones are areas where the hydrodynamic variables could cause a pedestrian to become unstable, depending on the intensity of the rainfall event, characterised by its return period. The map below shows the high-hazard areas for pedestrians for the simulated T1, T10 and T100 return periods, in both the current scenario and future scenario (i.e. with the changes caused by climate change on rainfall patterns):

Source: Prepared for this report with data from PDISBA’19 - RESCCUE Project


For the one-year return period (T1), in both the current and future scenarios, the high-hazard areas are minimal (0.02% and 0.03% of the overall surface area, respectively). Therefore, in this case, climate change does not exacerbate the existing situation. For the ten-year return period (T10), the high-hazard areas grow by 240 ha, representing 3.9% of the city’s total walkable surface area. Climate change does not create new high-hazard areas, but it does extend existing zones consistently across all neighbourhoods to 312 ha, which is 5.1% of the total surface area. This constitutes a 30% increase in the city’s high-hazard surface area. In the case of T100, the current situation deteriorates significantly, as new high-hazard areas appear and existing T10 extend considerably, to cover 9.5% of the total surface area of Barcelona (585 ha). In the case of the future scenario, once again, there is a 30% increase in the walkable surface area deemed high-hazard for pedestrians, reaching 12.4% of the total surface area (762 ha). The following graphic summarises the results of the pedestrian hazard maps, categorised by level of hazard:


Figure 2. Percentage of total surface area for each pedestrian hazard level for the current and future scenarios with all simulated return periods


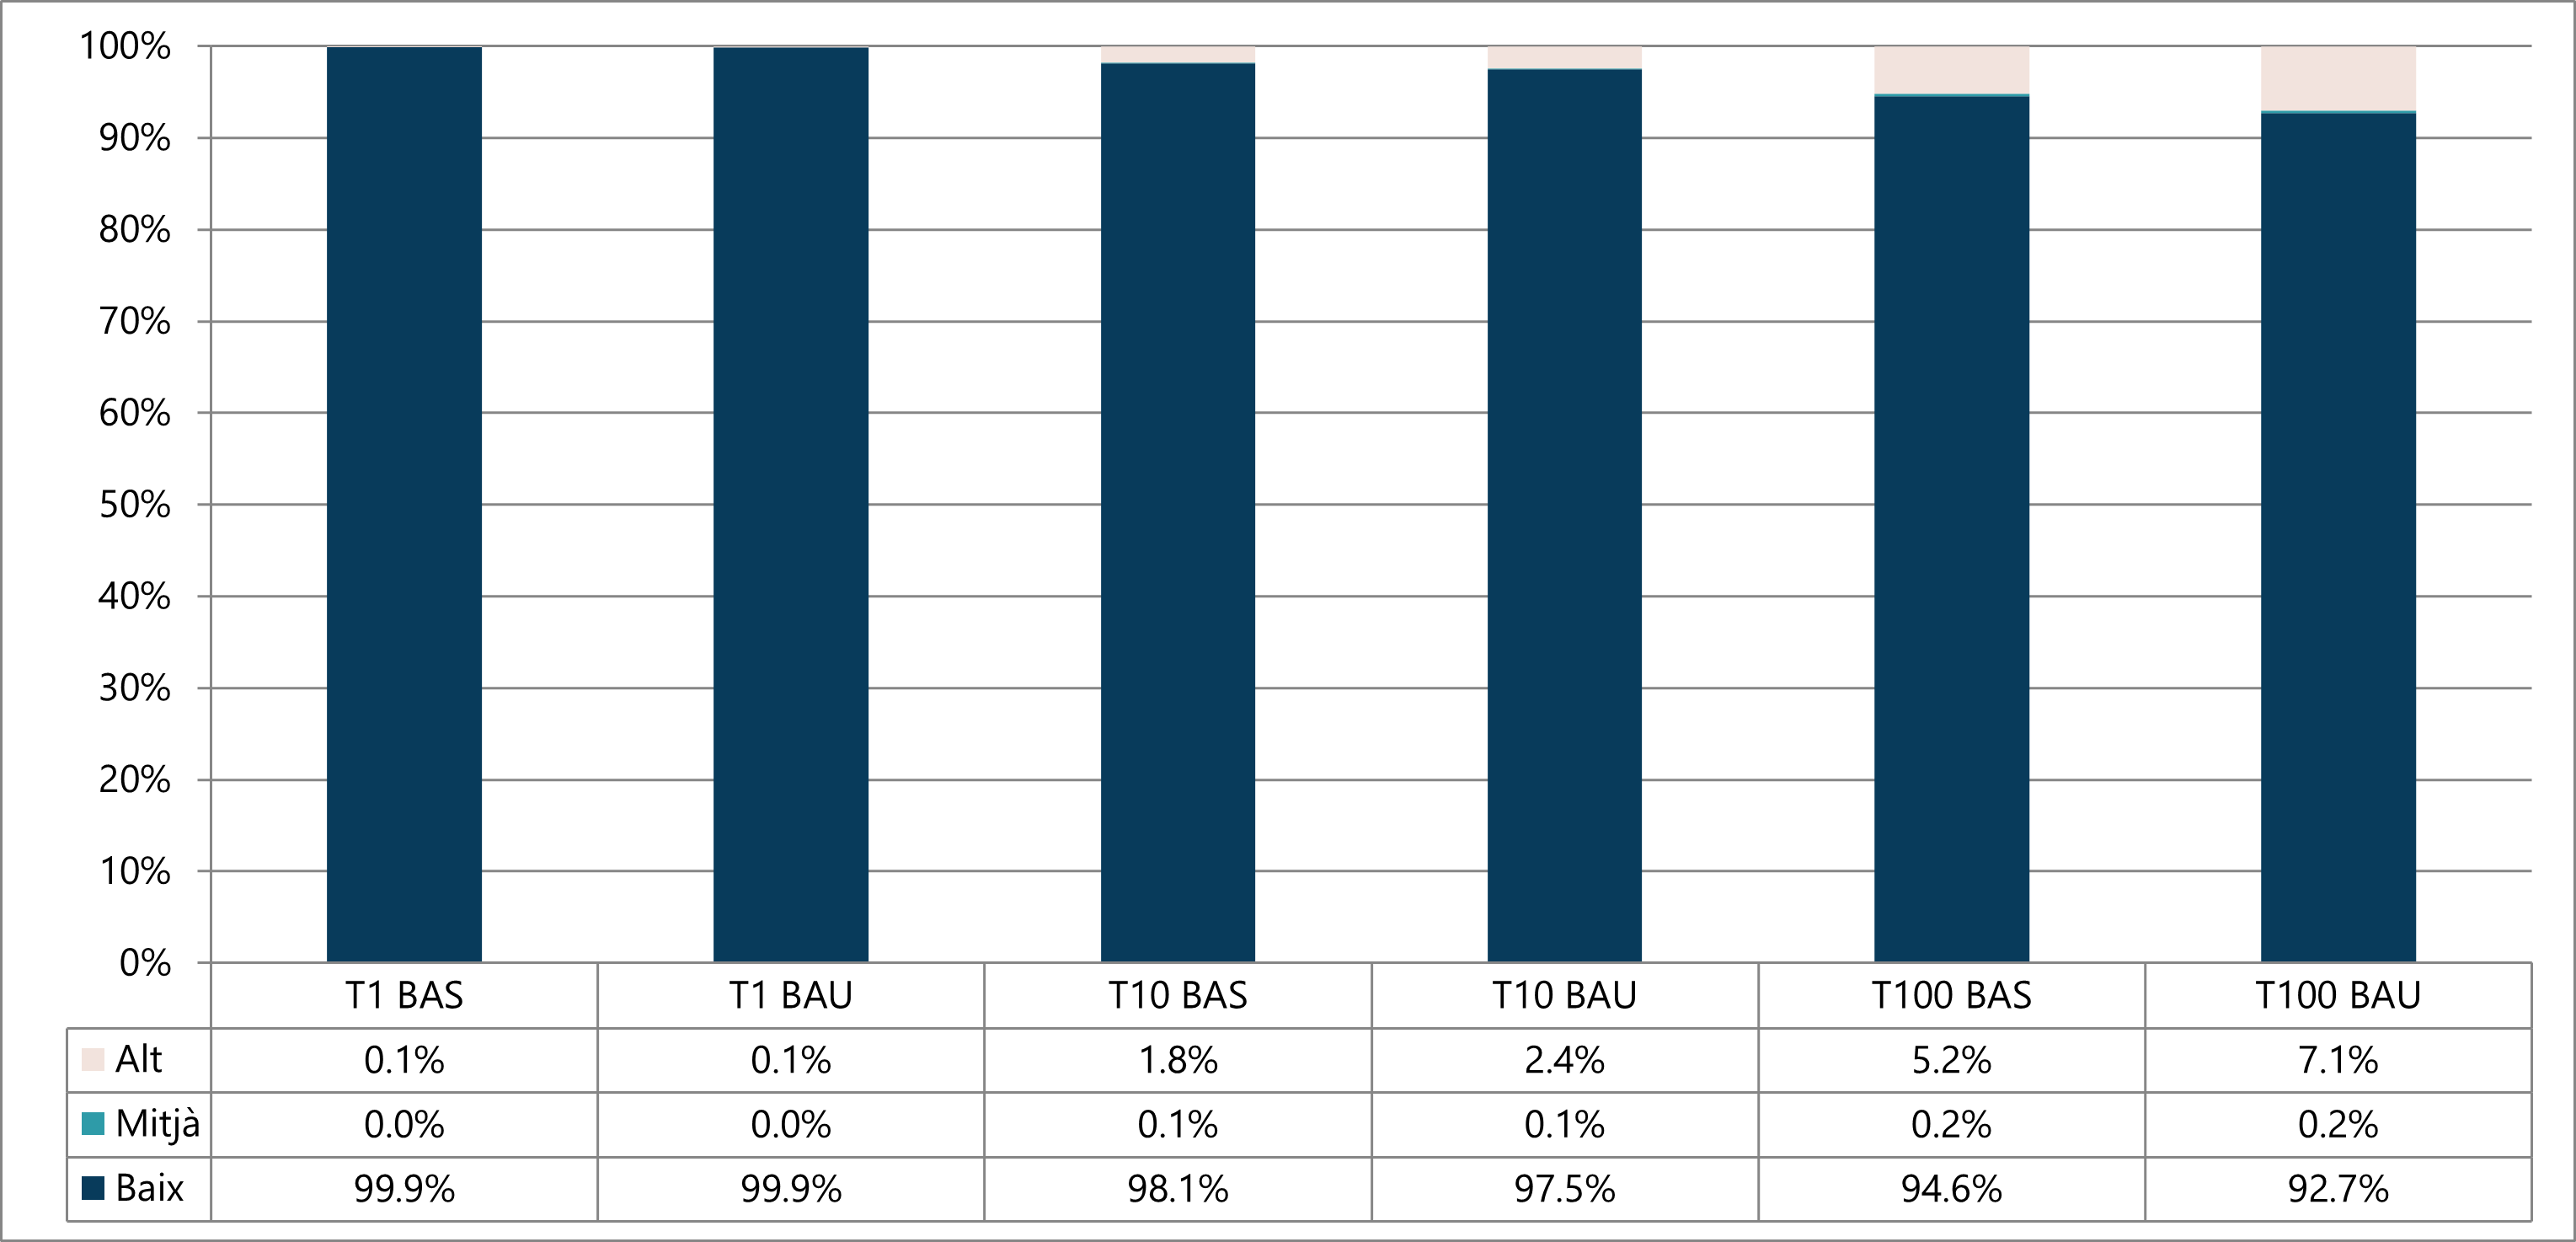
In addition, the following hazard maps show the probability of a vehicle being swept away by surface water flow:

Source: Prepared for this report with data from PDISBA’19 - RESCCUE Project

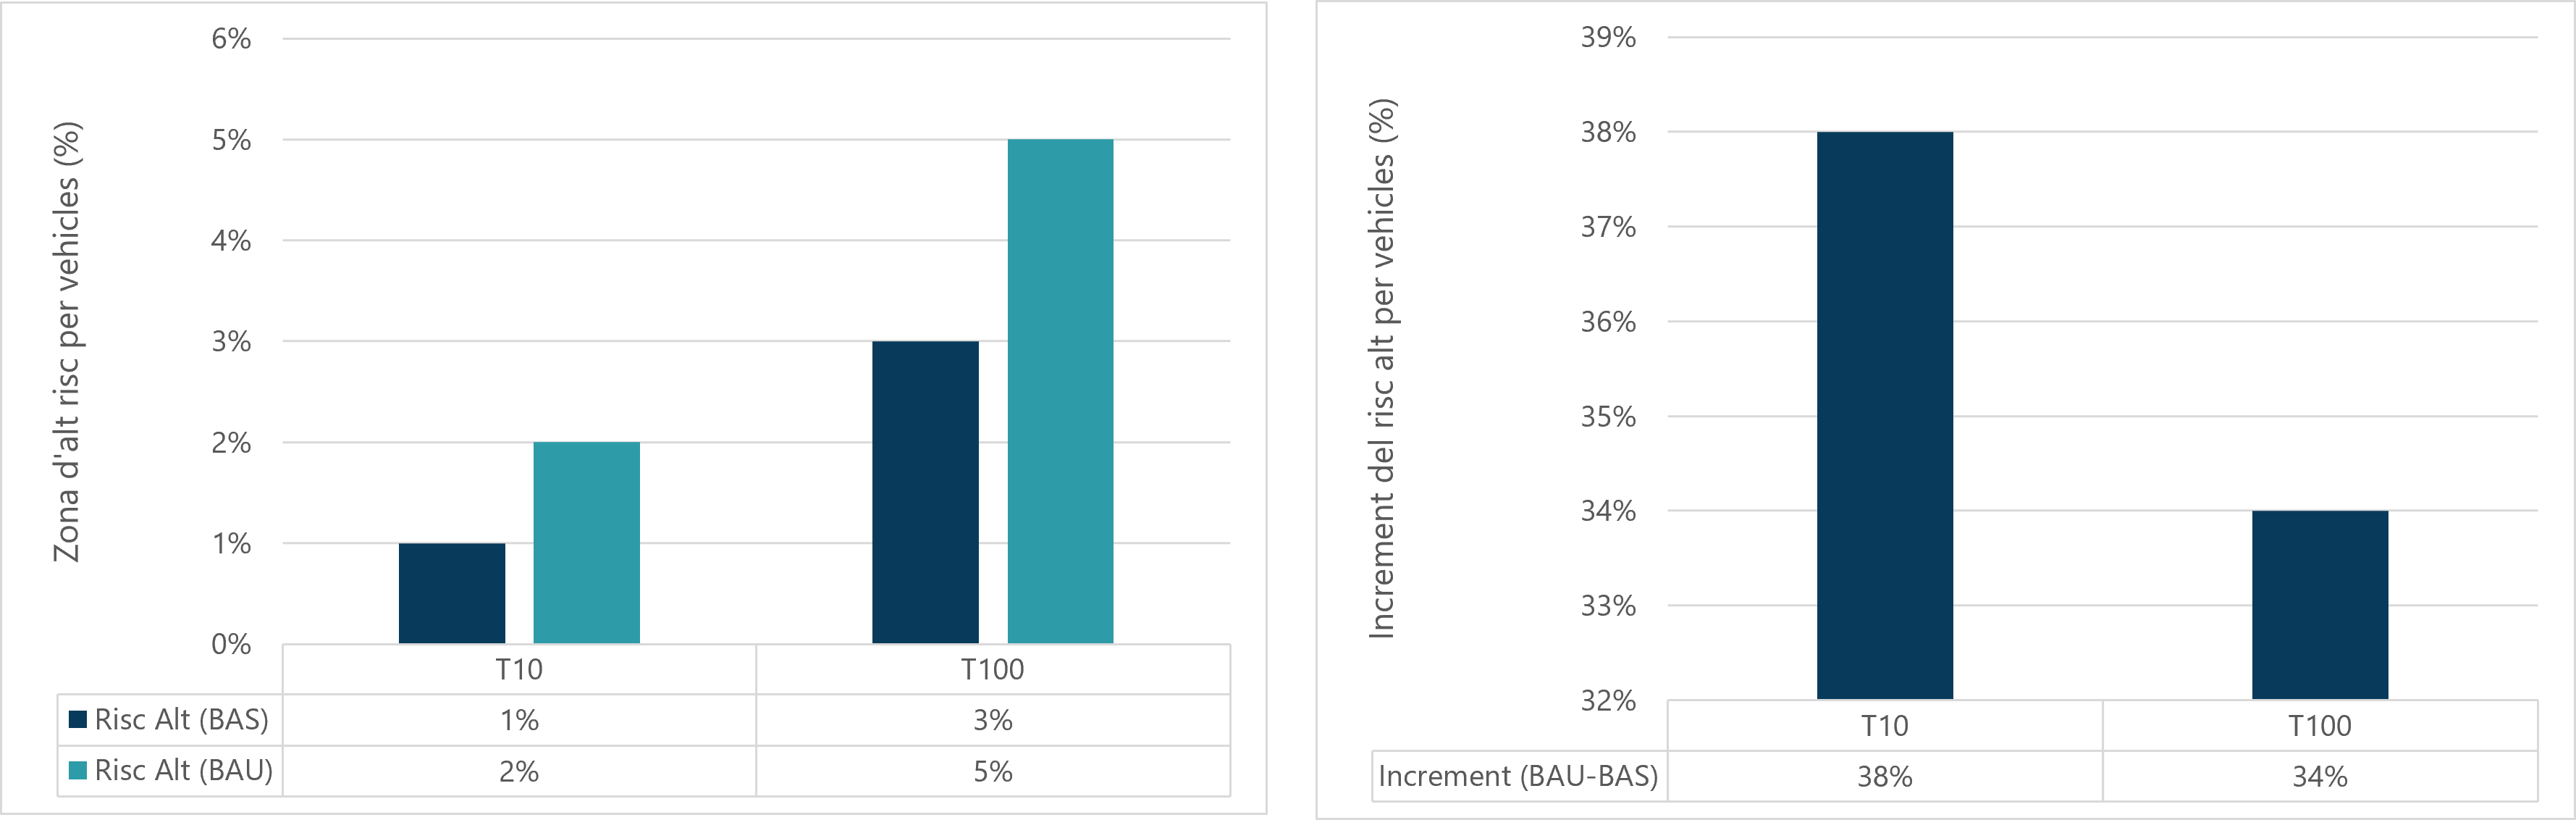
Once again, the high-hazard areas for the T1 return period are practically non-existent. However, for T10, the high-hazard areas are the same as for pedestrians, except that in this case they are spread over fewer streets. In the current scenario, they cover a surface area of 110 ha (1.8% of the total), and in the future scenario, they cover 148 ha (2.4%), which is a 34% increase. For T100, the trend in the pedestrian hazard results is reproduced, with an increase of 318 ha (5.2%) in the current scenario and of up to 433 ha (7.1%) in the future scenario (constituting approximately a further 35% increase). The following graphic summarises the results of the vehicle hazard maps, categorised by level of hazard:


Figure 3. Percentage of total surface area for each vehicle hazard level for the current and future scenarios with all return periods simulated.


Therefore, following examination of the results of the hazard areas for pedestrians and for vehicles, the following conclusions can be drawn:

  -The hazard trends are similar for pedestrians and vehicles.

  -The medium-hazard areas are irrelevant for all return periods.

  -The surface area of the pedestrian high-hazard zones for is twice that of the vehicle high-hazard zones, indicating that pedestrians are less stable than vehicles, as the latter is more resistant to slipping.

  -The high-hazard areas are practically non-existent for T1, even in the future scenario. This is down to the fact that the city’s sewage system is designed for a T10 design period. Therefore, for T1, no climate change impacts caused by increased design rainfall are observed, as the system has the capacity to absorb it without difficulty.

  -From T10 upwards, a proportional hazard increase of around 30–35% can be seen for all return periods.

Vulnerability


The following step defines the vulnerability of people deemed at risk in this study. Various levels of vulnerability were established, according to people’s exposure (density of people) and physical characteristics (sensitivity), as well as indicators like percentage of population at critical age, population density and percentage of population from other countries. The presence of vulnerable infrastructures, such as schools, hospitals and old people's centres, was also considered in this vulnerability assessment. The weighting of the indicators used allocated population density a weight of 50%, which led to the areas with the highest levels of pedestrian vulnerability coinciding almost entirely with the most densely populated neighbourhoods.

Furthermore, vehicle stability can compromise people’s security, so traffic flows were analysed (exposure indicator) to define the vulnerability levels of each street. The following figure shows the vulnerability criteria for pedestrians and vehicles exposed to urban flooding:


Figure 4. Vulnerability criteria for pedestrians and vehicles exposed to urban flooding.

The vulnerability maps represent pedestrians’ or vehicles’ vulnerability when exposed to flooding from rainfall in specific areas of the city and establish three qualitative levels: low, medium and high.

Source: PDISBA’19 - RESCCUE Project

Risk

Once hazard and vulnerability had been defined, risk maps were drawn up. The result of this process is a qualitative map that establishes three risk levels (high, medium and low) for pedestrians or vehicles in specific areas of the city, based on the combination of the hazard level caused by flooding from rainfall and vulnerability level. The following pedestrian risk maps compare the current and climate change scenarios for the T10 and T100 return periods:

Source: PDISBA’19 - RESCCUE Project

The resulting high-risk areas are summarised in figure 5. In addition, the variation in risk areas for pedestrians is also presented in order to highlight the effect of climate change in terms of increased high-risk areas in Barcelona.


Figure 5. High-risk areas (as a %) and increase in surface area (as a %) for pedestrians in the current and future scenarios for the T10 and T100 return periods.

This figure shows that the increased maximum intensity of torrential rains due to the effects of climate change leads to an approximately 30% higher risk for pedestrians.

Furthermore, the above risk maps define the most problematic areas of the city for pedestrians according to its high-risk areas, in both current and future scenarios, and show how the effects of climate change increase risk.

First, the parts of the city with the highest concentration of high-risk areas are identified. They coincide almost entirely with the most significant critical points in the city, because of the poor functioning of the network, except for areas of low population density (as these are therefore not high-vulnerability areas). For easier comprehension, they have been categorised into axes:

  - Axis 1: in the Esquerra de l’Eixample, Sant Antoni and El Raval neighbourhoods, starting in the Diagonal - Pl. Francesc Macià area, continuing along Villarroel - Casanova - Av. Roma - Comte d’Urgell - Comte Borrell, until reaching the area surrounding Carrer de Sant Pau: around La Ronda and Carrer de Sant Pau, Sant Antoni Abat, Paral·lel, Rambla del Raval and Avinguda de les Drassanes.

  - Axis 2: Passeig Sant Joan – Bailèn – Diagonal.

  - Axis 3: Vallcarca - Riera de Cassoles - Via Augusta.

  - Axis 4: Area between the Rambla de Badal and Riera Blanca, from Munné - Carrer de Sants, Bacardí and Parcerisa at Constitució until Carrer de Quetzal.

  - Axis 5: Sant Andreu area, starting at Nou Barris and ending at the La Sagrera set of rail tracks. Axis between Carrer d’Alella, Rambla de Fabra i Puig and Rambla d’Onze de Setembre, and Tajo - Cartellà - Riera d’Horta axis.

The results show that, for a return period of 10 years, climate change can significantly enlarge the high-risk areas in the identified critical axes. The following figures show the high-risk areas for pedestrians and how much they increase in size, according to these axes.


Figure 6. High-risk areas (in ha) and increase in surface area (as a %) for pedestrians in the current and future scenarios for the most significant return periods on the axes with a higher concentration of high-risk areas.


Regarding the high-risk areas for vehicles, the results follow the trend seen in the evaluation of hazard for vehicles and risk for pedestrians; therefore, the conclusions and considerations specified above are valid.

Source: PDISBA’19 - RESCCUE Project

It is worth noting how the results show that some areas categorised as highly hazardous in terms of flooding potential present less risk for vehicles than for pedestrians. Nonetheless, the results show that climate change may lead to an increase in high-risk areas of around 40% and 35% for the 10- and 100-year return periods, respectively (Figure 7).


Figure 7. High-risk areas (in %) and increase in surface area (in %) for vehicles in the current and future scenarios for the most significant return periods.

Adaptation

Once the increase in high-risk areas for pedestrians and for vehicles was assessed, the project went on to evaluate the introduction of improvements to the sewage network. These improvements are divided into two adaptation scenarios: the first, with implementation of sustainable drainage systems (SUDS) across the city (Adapt. Scenario 1), and the second, with the introduction of structural improvements to the sewage network (improvements to pipes, installation of rainwater tanks, etc.) as well as SUDS (Adapt. Scenario 2).

Below are the pedestrian risk maps resulting from the simulation of the models, once adaptation scenarios 1 and 2 were introduced:

Source: PDISBA’19 - RESCCUE Project

When the future scenario – meaning the current state of the city affected by future rainfall conditions caused by climate change – is compared with various adaptation scenarios, a risk reduction figure can be obtained (the reduction in the percentage of surface area with high risk of flooding). As shown in Figure 8, it is predicted that sustainable urban drainage systems (SUDS) installed throughout the city will reduce risk by 34% in the case of precipitation with a return period of 10 years, although the predicted risk reductions for longer return periods are less than 20%.

In addition, the joint implementation of SUDS and structural measures leads to an almost 100% reduction in both risks for design rainfall with a 10-year return period. This number decreases as the return period gets longer; for the 100-year return period, the reduction is 76%. It should be noted that adaptation scenario 2 proposes work on the city’s primary network, but considers the secondary network to have sufficient capacity.


Figure 8. Reduction of high-risk areas for pedestrians (in %) as a result of the measures implemented in adaptation scenarios 1 and 2 for the most significant return periods.


Furthermore, a detailed analysis of the reduction of risk for pedestrians on axes with a higher concentration of high-risk areas was carried out. In Figure 9, although a similar trend is observed in terms of risk reduction for pedestrians on a city-wide scale, there are some differences between axes.

Axes 1 (Esquerra de l’Eixample, Sant Antoni and El Raval) and 5 (Sant Andreu - Nou Barris area) benefit the most from the installation of SUDS, as this reduces their risk for pedestrians by around 30% for the most frequent kinds of precipitation (10-year return period). Meanwhile, axes 2 (Passeig Sant Joan) and 3 (Riera de Cassoles) benefit the least, with just a 12–13% risk reduction for pedestrians. It should be noted that axes 1 and 5 are the biggest so have the largest high-risk surface area and therefore have the greatest risk reduction.

However, implementation of the second adaptation scenario leads to a total risk reduction for all axes for design rainfall with a 10-year return period. As for the 100-year return period, the risk reduction achieved varies from 64% to 87%, depending on the axis under consideration.


Figure 9. Reduction of high-risk areas for pedestrians (as a %) resulting from the measures implemented in adaptation scenarios 1 and 2 for the most significant return periods on the axes with a higher concentration of high-risk areas.


Below are the risk maps for vehicles resulting from the simulation of the models, once adaptation scenarios 1 and 2 were introduced:

Source: PDISBA’19 - RESCCUE Project

Comparing the future scenario with various adaptation scenarios provides a risk reduction figure (the reduction in the percentage of surface area with high risk of flooding). As shown in Figure 10, it is predicted that sustainable urban drainage systems (SUDS) installed throughout the city will reduce risk by 45% in the case of precipitation with a return period of 10 years, while the predicted risk reductions for longer return periods are over 20%.

In addition, the joint implementation of SUDS and structural measures leads to an almost 100% reduction in both risks for design rainfall with a 10-year return period. This number decreases as the return period gets longer; for the 100-year return period, the reduction is 87%.


Figure 10. Reduction of high-risk areas for vehicles (as a %) as a result of the measures implemented in adaptation scenarios 1 and 2 for the most significant return periods.


To consult the full study, click HERE.

To consult further information on the project RESCCUE:Visit RESCCUE

nt.match(/Trident.*rv\:11\./)) { $('html').addClass('ie11'); }