Introduction
Access and proximity to public green spaces are essential elements in guaranteeing adequate living conditions and improving the quality of life for everyone, particularly in densely populated urban settings such as the city of Barcelona. The socio-environmental benefits offered by urban green spaces include, amongst others, greater opportunities for social interaction, higher levels of animal biodiversity, the mitigation of the effects of climate change, and reduced atmospheric and acoustic pollution. It is widely agreed that access to high-quality green spaces has a strong correlation with the performance of outdoor sport, and that it also helps to reduce stress, unwanted solitude and depression, with this being particularly true for the elderly population.
Proximity and accessibility to high-quality green spaces, comprising the various types of urban green areas, are therefore crucial in ensuring social cohesion and the overall wellbeing of the people who live there.
This document sets out to offer a more detailed analysis of the proximity of different population groups to the city’s public green spaces. The aim of this analysis is to identify areas of the city where a scarcity of green space can have a negative effect on the daily life and wellbeing of people – particularly children and the elderly – when it comes to the use of public spaces, with potential negative repercussions on their health and wellbeing.
Public green spaces as a basic service
Defining the city as a service provider and understanding public green space as one of the basic services to be provided to citizens, the effectiveness of this service is determined by the supply (or provision) of green spaces and their characteristics, as well as their accessibility, while taking into account distance and the presence of physical barriers and/or constraints of mobility on foot
The map shown below depicts all of the city’s public-access green spaces (parks, green spaces within blocks and green squares) which have a surface area of more than 0.5 hectares. It also includes the points of access to the Collserola Nature Park and the Besòs River Park. The analysis covers a total of 190 green spaces around the city, including:
• Historic parks (defined as such by the Barcelona City Council)
• Parks and gardens (the basis of the city’s urban green infrastructure)
• Green spaces within blocks.
• Green squares (with more than 30% plant coverage and 40% permeable soil)
• Points of access to the Collserola Nature Park and the Besòs River Park
The study does not include private gardens and other areas that are not treated as public spaces.
Areas farthest from green spaces
In order to analyse proximity to green spaces, we have considered variables such as walking speed, streets´ slope and the presence of facilities conceived to improve vertical mobility. These variables are defined as follows:
- Walking speed per age group. The walking speed of people aged between 0-4 years old and 75 years old and above – in other words, the most ‘vulnerable’ groups – was calculated at 2 km/h. The walking speed for all other age groups was calculated at 4 km/h.
- Streets’ slope. The steeper the slope, the slower the walking speed. This means that parks in areas with steep slopes tend to cover smaller areas of land compared to the parks that are located in flatter parts of the city.
- Presence of facilities conceived to improve vertical mobility. (outdoor lifts and escalators). Different speeds were calculated for areas with outdoor lifts and escalators. In particular, 1.8 km/h was applied for stretches with outdoor escalators. In areas with outdoor lifts, 30 seconds was added in order to recreate the time waiting for and using said lift.
The end goal of the analysis was to detect, on a city-wide scale and in an indicative way, where people affected by a lack of proximity to public green spaces – i.e. those who have to walk more than 5 minutes to reach one – are located.
The following map shows proximity to public green spaces in the city. It is expressed as walking time from the aforementioned green areas and calculated for different age groups, and therefore different walking speeds. To see the results for each population group, select the age group in the legenda on the left-hand side of the map.
Where are the most vulnerable groups locate?
While the scarcity of green areas of proximity can represent a source of vulnerability for the population as a whole, it is worth pointing out that some profiles – due to either their age or their state of health – are more vulnerable than others. In this regard, the demographic groups with the greatest mobility constraints, regardless of their health conditions and the presence of significant physical barriers, are
Identifying the most critical points
In order to identify the areas where the population has less access to the city’s public green spaces, the map below analyses territorial information on the proximity to green spaces addressed in the previous section against two sets of demographic data:
1) The 2018 census – disaggregated into different age groups (0-4, 5-14, 15-34, 36-74, 75 and above) for each residential block – in order to ascertain the areas with the highest population density.
2) Public facilities – classified according to the type of facility and linked to age groups – to identify the parts of the city that may be more frequented by certain population groups.
The first dataset was used to identify the areas with the greatest density of residents, broken down into age groups. The latter, meanwhile, were used to identify the parts of the city that are potentially most used by the different population groups. This is based on the hypothesis that the areas with the greatest concentration of mobility facilities intended to be used by these groups are also those that are most frequented by said groups.
The aim of this exercise is to highlight, in a qualitative way, the areas in which a cross-over exists between the highest exposure to risk (in this case, being far away from green areas) and residential blocks where population density is above the city’s average and areas with a high concentration of mobility facilities intended to be used by the age group being analysed.
Despite this, it must be stressed that the question ‘Where are the most vulnerable groups located?’ does not have a single answer, since the mobility of the population varies depending on the time of day, people’s jobs and their recreational activities. It should therefore be noted that this is a rough approximation that seeks to answer the question on the basis of the data available to us. These maps thus serve to provide a general overview, and must be read in the appropriate context during any analysis.
The following map analyses the proximity to public green spaces (walking speed of 2 km/h) against population density and concentration per age groups (0-4 years and 75+). To see the results for each population group, select the age group in the legend on the left-hand side of the map.
The following map analyses the proximity to public green spaces (walking speed of 4 km/h) against population density and concentration per age groups (between 5 years and 75 years). To see the results for each population group, select the age group in the legend on the left-hand side of the map.
Finally, by analysing the areas with the highest population density and facilities intended to be used by the most vulnerable group (0-4 years and 75 and above) against the information provided on areas with a lack of public green spaces, some critical points of greater vulnerability were identified. The overlap between each of the three biggest walking distance thresholds (5-10 minutes, 10-15 minutes, and more than 15 minutes) and the areas with the highest population density and concentration of facilities generates a level of vulnerability that is reflected in the following six levels:
| 1P. 5-10 minutes away, coinciding with population density above the average |
| 1PE. 5-10 minutes away, coinciding with population density above the average and concentration of public facilities |
| 2P. 10-15 minutes away, coinciding with a population density above the average |
| 2PE. 10-15 minutes away, coinciding with population density above the average and concentration of public facilities |
| 3P. More than 15 minutes away, coinciding with population above the average |
| 3PE. More than 15 minutes away, coinciding with population above the average and concentration of public facilities |
Based on the categories defined in the previous table, the map below shows the points of greatest vulnerability in the urban fabric for the different age groups. To see the results for each demographic, select the age group in the legend on the left-hand side of the map.
On a general level, there are multiple parts of the city that are located far from any public green spaces, regardless of the walking speed taken for the analysis. Irrespective of the age group being analysed, these areas of greatest deficit cover vast swathes of the Gràcia neighbourhood, much of the central Eixample (between Carrer Casanovas and around Passeig de Gràcia), the Barri Gòtic, Camp de l’Arpa and the Poble Nou 22@ district.
If we only focus on the results obtained in the vulnerable population maps (people aged 0-4 years and 75 years and above with a walking speed of 2 km/h), we can see that many more deficit areas need to be added to those already highlighted in the public green space proximity map. These include, for example, Sant Antoni, Poble Sec, Sants, La Maternitat, La Verneda and Besòs. There is also a lack of nearby public green space in much of the Horta-Guinardó district, since despite having huge parks nearby, they are difficult to access and are found in areas with very steep slopes.
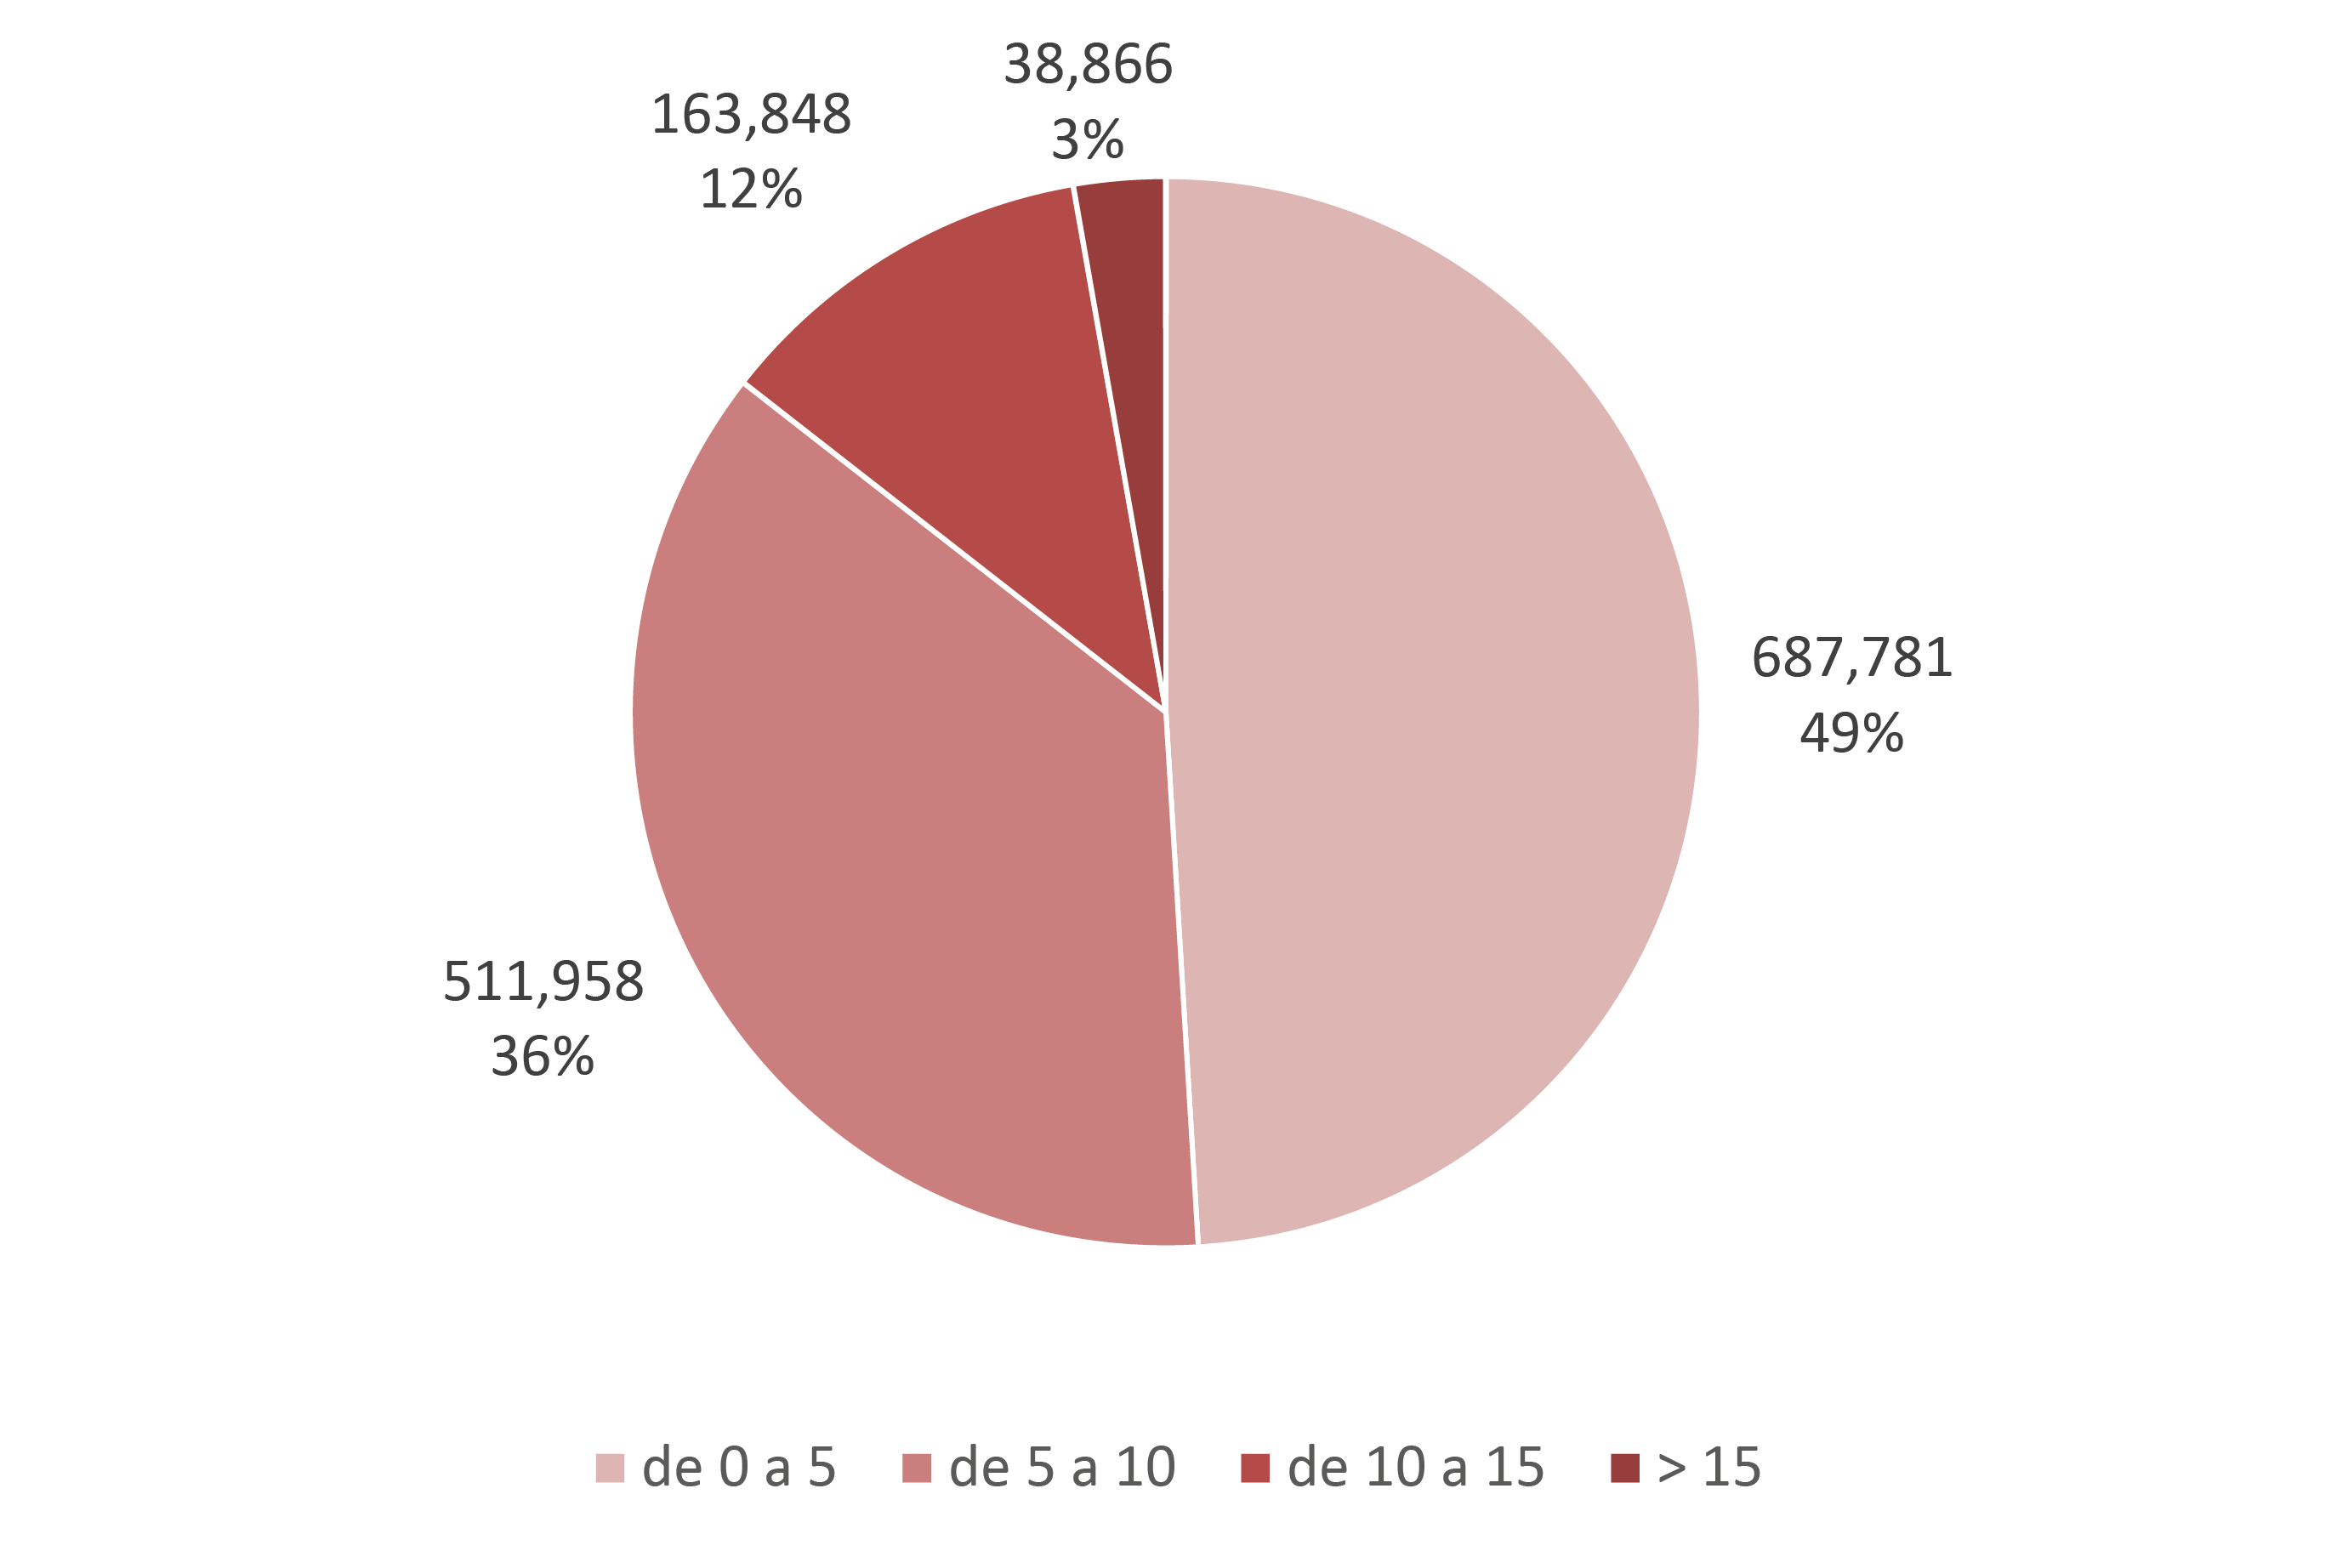
In order to complete the analysis, population data have been extracted and classified according to their proximity to green spaces. Charts 1 and 2 show the extent to which the population in the vulnerable groups live far away from public green spaces compared to the population in the other age groups. The results show that practically half of the population between 5 and 74 years of age has a public green space of more than 0.5 hectares within a five-minute walk from their home. For the population group considered to be vulnerable, however, this figure stands at only 20%. In fact, for around 50% of the vulnerable population, their nearest green space is more than a 10-minute walk away.

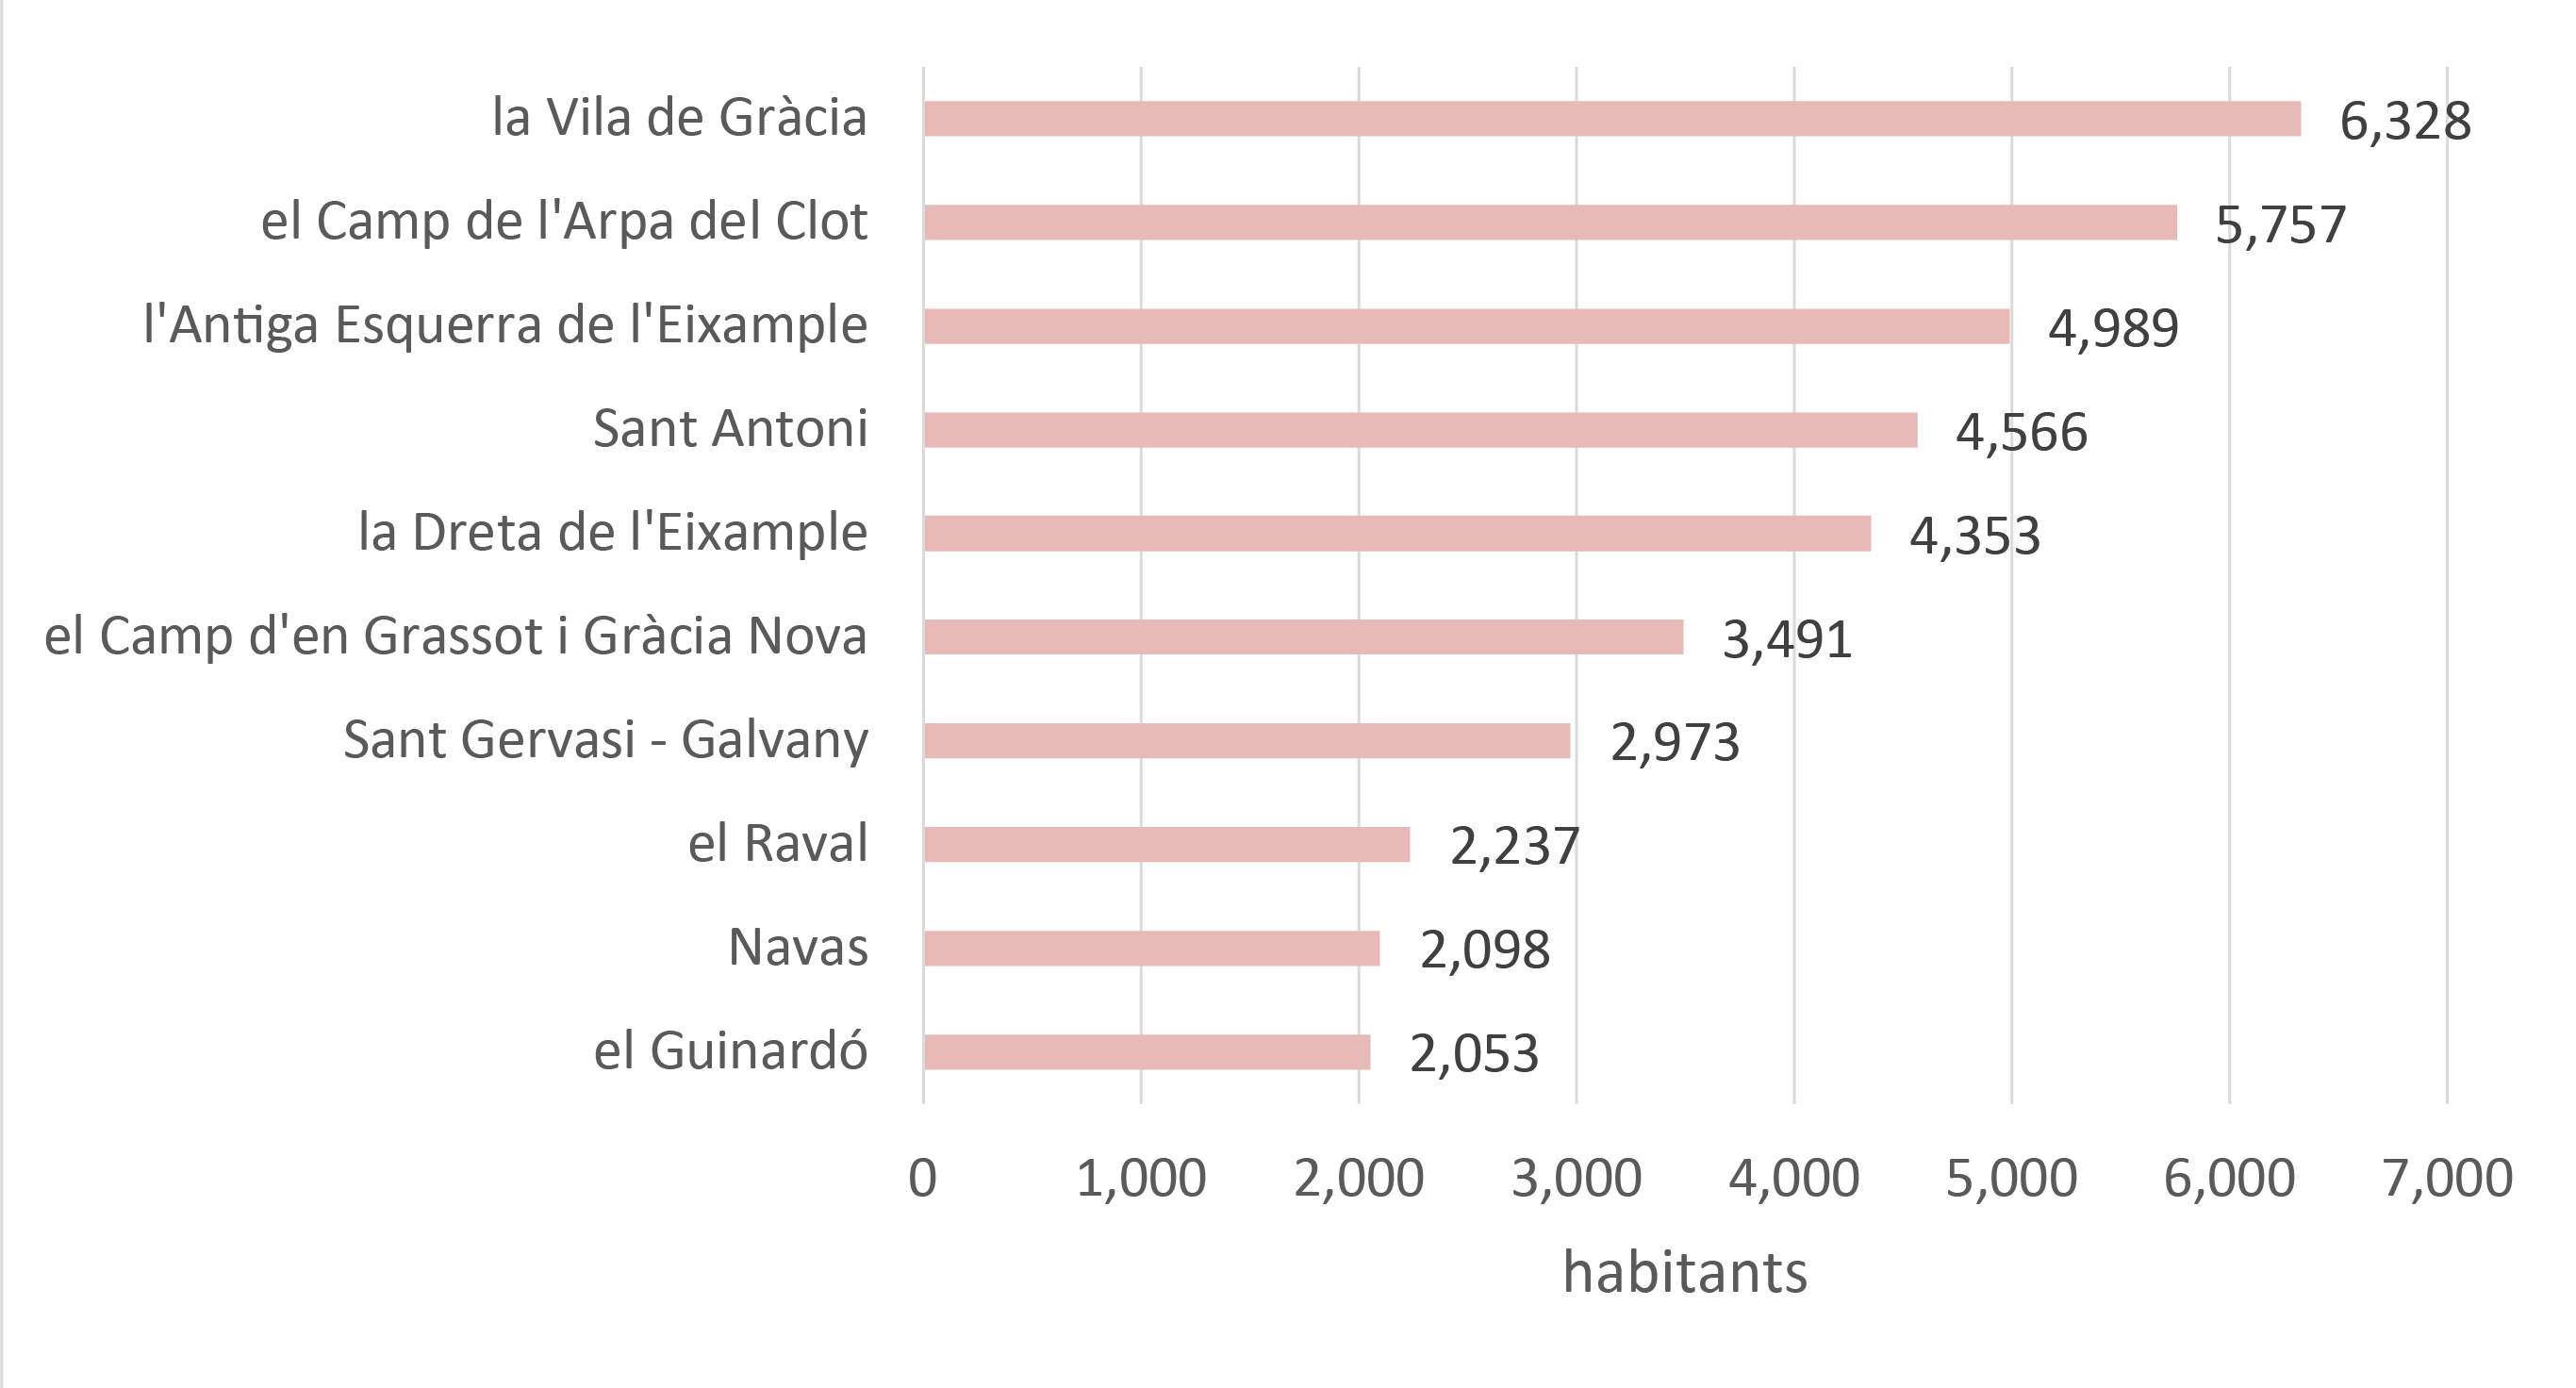
Lastly, we sought to identify the neighbourhoods in which vulnerable population (aged 0-4 years and 75 years and above) were furthest away from public green spaces. Chart 3 shows the top 10 neighbourhoods in which members of the vulnerable group do not have any green spaces within a 15-minute walk from their home.
Related actions
The Barcelona City Council has some ambitious goals for increasing and improving the city’s green infrastructure. Specifically, the target set in the Barcelona Climate Commitment, which is also included in the Barcelona Climate Plan (2018) and, more recently, in the Climate Emergency Declaration (2020), is to incorporate 1.6 km2 of green space by 2030.
All those measures that seek to increase urban greenery will be key in creating nearby green spaces that are more accessible to the population, as well as reinforcing the quality and broadening the range of socio-environmental services that green infrastructure provides.
A series of action plans have been developed over the last few years, including the local government’s ‘Programme for Promoting Urban Green Infrastructures’ (2017) and the ‘Green Infrastructure and Biodiversity Plan 2020’, which specify measures that serve to increase green infrastructure, improve it through the conservation of urban biodiversity and ensure that citizens can enjoy a natural nearby environment that helps to keep them well and healthy.
Some of the main initiatives carried out over recent years include large, city-wide projects for increasing green infrastructure as well as smaller one-off projects. Some of the large-scale projects include the ‘Urban Canopy’ (Plaça de les Glòries Catalanes), the Doctor Pla i Armengol Garden (Mas Ravetllat), the new Cristóbal de Moura green axis and the transformation of Avinguda Meridiana. These are in addition to the increased amount of green space associated with pacification processes, such as the reurbanisation of the Sant Antoni ‘super block’, which could be applied to other parts of the city in the future. Insofar as small-scale projects are concerned, green rooftops have been promoted; unused spaces have been handed over for agricultural purposes as part of the BUITS (Empty Urban Spaces with Territorial and Social Involvement) Plan; and vertical gardens have been installed on party walls. More recently, the new plans for the 22@ district in Poble Nou and the establishment of green axes in Eixample represent a great opportunity for a structural transformation that integrates green infrastructure and environmental services into the city’s urban fabric
Another transformative project was the effort to naturalise the city. While this has been attempted in the past, the impact of the COVID-19 pandemic and the measures implemented to mitigate the spread of the virus (and the subsequent reduced mobility and activity of the population) led to the city’s parks, gardens, banks and allotments being allowed to grow naturally. These transformations, accelerated due to lockdown measures implemented due to the pandemic, are to be enhanced through maintenance work that, without reducing quality standards, will boost the city’s naturalisation and mark a significant step forward in the fight against the climate emergency.
The Barcelona Resilience Programme seeks to highlight the efforts made by the local government to implement structural measures with a view to increasing the city’s green spaces and socio-environmental services. It is also an opportunity to promote, prioritise and identify opportunities for measures, in the most vulnerable territories, which contribute to the transformation of urban space through green infrastructure projects, with a view to harnessing its potential as an element that generates resilience in the face of environmental challenges (pollution, thermoregulation, mitigation of the urban heat island effect, etc.). There are also social benefits, with this being an essential element in ensuring the complete wellbeing of the city’s residents.