Introduction
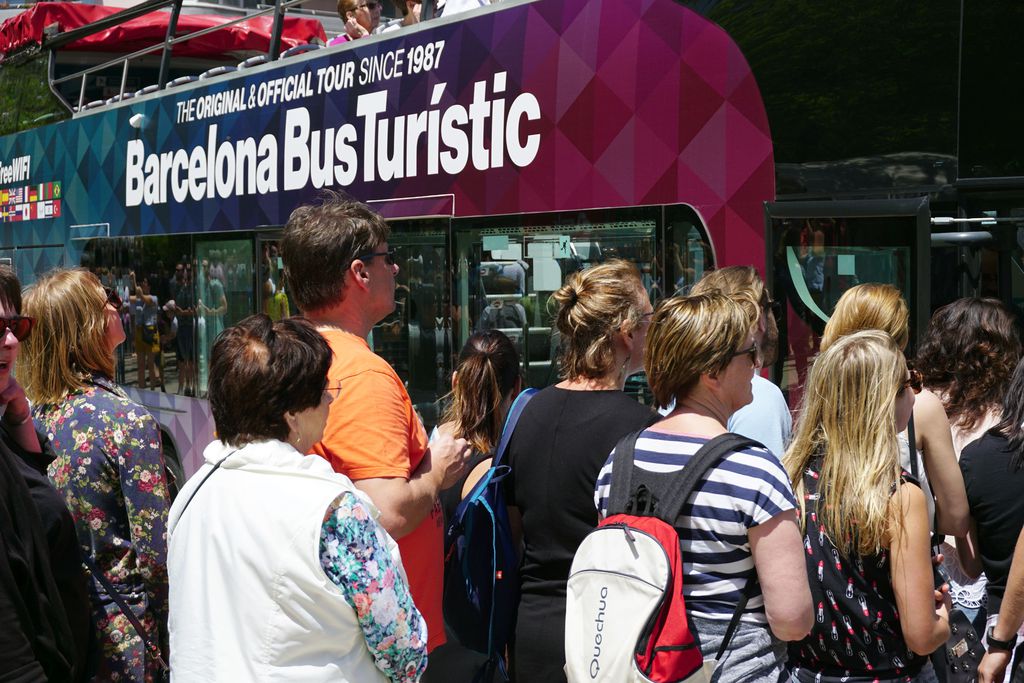
Since the 1992 Olympic Games, Barcelona has positioned itself as an international tourist destination, with tourism growing rapidly, leading to significant negative social and economic effects on the city’s urban fabric. This reality must be placed in a historical context in which Barcelona opted for promoting tourism accompanied by investment in infrastructures, while globalisation and economic conditions favoured the growth of mobility on a global scale.
In spite of the sector’s economic contribution, tourism also generates a series of negative impacts in terms of maintaining sustainable growth. In this regard, this document takes a more detailed look at the touristic pressure that the city’s urban fabric is exposed to, with the aim of identifying those areas where a greater concentration of touristic activities may negatively affect people’s everyday lives and well-being – with a special look at the fruition of public green spaces, the use of public transport and the proliferation of tourist flats.
In this context, it is also necessary to clarify that the information used in this study is from before March 2020, and therefore gives an image of the city that pre-dates the Covid-19 pandemic.
Pressure of tourism
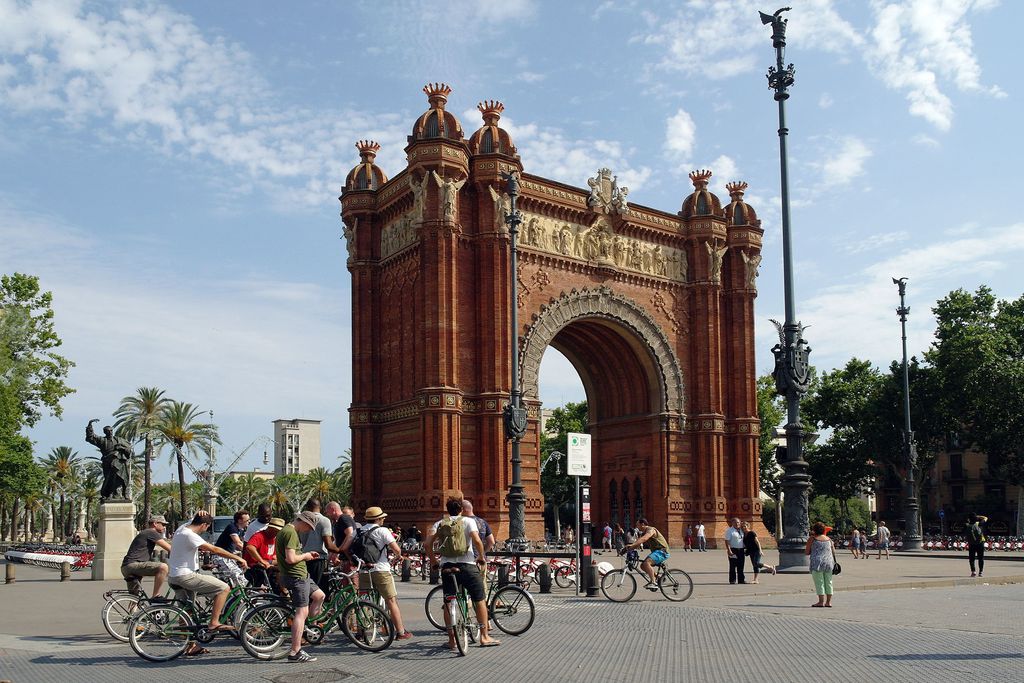
In 2019, Barcelona was visited by more than 30 million people, with a daily average of 154,641 visitors. This figure is reflected in the fact that 14% of the city’s GDP came from tourist activity and 9% of employment in the city is in that sector.
Although tourism creates wealth and employment, the revenue is not always distributed equitably and the associated jobs are often insecure, with low-skilled work and temporary contracts. Tourism drives new entrepreneurship but standardises part of commerce. It causes negative impacts on the use of natural resources, socio-cultural effects and increases pressure on infrastructures, mobility, public spaces and the general management of the city. It also stimulates the property market, while contributing to a trend towards gentrification that is typical of a compact, densely-populated city like Barcelona. For example, in recent years, there has been an additional impact on the housing market, caused by interference in the residential housing market by touristic use, further reducing an already limited offer of affordable rental housing. Therefore, in Barcelona, just like other cities around the world, tourism has involved major changes to urban and social-spatial dynamics, altering the daily lives of city residents and generating dependency and an economic monoculture in those areas with a greater number of tourism-related activities. In the 2019 Municipal Barometer, 5.4% of Barcelona residents considered tourism to be the city’s most serious problem.
If we take into account that pressure from tourism is not ubiquitous but occurs in a specific area, then in order to create a general picture on a territorial scale of how tourism interacts with the everyday lives of people who live in Barcelona, four maps were created focusing on the following subjects:
1- Registered population in areas with a higher intensity of touristic activities
2- Urban green spaces in areas with a higher intensity of touristic activities
3- The metro, bus and TRAM network in areas with a higher intensity of touristic activities
4- The percentage of tourist flats (HUTs) over the number of flats per block, in areas with a higher intensity of touristic activities.
Areas with higher concentration of tourism
The definition of areas with the highest touristic intensity is based on the territorialisation of an aggregated indicator, which brings together various factors linked to activities related to the sector (Table 1). The calculation evaluates density at a city-wide level, according to the impact that the various factors have on public spaces. These factors are divided into three categories: ‘Accommodation’, ‘Leisure’ and ‘Tourist Attractions’. Each one has been assigned a weighting coefficient according to their potential impact on everyday activities that Barcelona residents carry out in public spaces. The following table shows the list of categories, factors and assigned coefficients. The coefficients were assigned by considering how attractive the factors were for tourists and what implications an increase in the intensity of their use have on the city’s public spaces.
| Category | Category coeficient | Factor |
|---|---|---|
| Accommodation | 0,6 | Number of places in hotel establishments |
| Number of places in hostels, guest houses and youth hostels | ||
| Places in tourist-use accommodation (HUTs) | ||
| Accommodation places advertised on the Airbnb portal (and which have not been counted in the HUT database) | ||
| Leisure | 0,8 | Bars and restaurants |
| Souvenir shops | ||
| Clothing and accessories shops | ||
| Tourist attractions | 1 | Number of visitors to Points of Interest in the City (PICs) |
| Photographs on the Panoramio platform | ||
| Number of visitors to beaches |
A density map was created for each factor and the values were normalised. Subsequently, the values for these factors by category were added, resulting in the three maps shown below. In order to alternate between the results for each category, select them in the key located on the left-hand side of the map.
Lastly, these three maps were aggregated to produce a fourth map showing the pressure of tourism, which was classified into two intensity levels: medium and high. This last map is the one used as a basis for analysing this activity’s impact on the four aspects mentioned above (resident population, urban green areas, public transport networks and housing).
Effects of tourist activity intensity
Based on the maps of areas subjected to a higher intensity of tourist activities, data has been cross-referenced in order to analyse how this activity affects various aspects of the resident population’s daily lives. The analysed aspects were:
- effects on the resident population,
- effects on green spaces,
- effects on public transport, and
- effects on housing.
The results obtained for each of the analysed subject areas are shown below.
Effects on the resident population
The following map cross-references information on touristic intensity levels and the average population density of city residents, adding information about recorded incidents in tourist flats or those that required the intervention of civic agents. In order to generate these layers, the following databases were used:
- Population density per residential block, calculated using data from the 2018 municipal register of residents.
- Total number of interventions by civic agents from July to December 2018. Department of Tourism.
- Concentration of incidents relating to HUTs where intervention was required, from January to September 2019. Coexistence and Tourism Service.
If we consider the surface area contained between the city’s ring roads, excluding Montjuïc, i.e. the part of the city with higher residential density, the area occupied by locations with a high intensity of touristic activities occupies 35% of that territory, showing that, apart from being a massive phenomenon in the city, tourism is also an extensive one, with activities related to the sector affecting a sizeable proportion of municipal territory. However, this extension should not be taken as generalised, homogeneous overcrowding in all public spaces, but rather as a territorialised representation of a phenomenon that is concentrated at specific locations, at specific times of year – and even on specific days and at specific times of day – although it has systemic effects on housing, land uses and types of economic activities that go way beyond those critical points. It should be remembered that in a pre-Covid-19 context, Barcelona received around 30 million tourists a year, which means 150,000 visits a day – i.e. adding an additional 10% to the resident population every day.
The following map shows the overlap between the areas of greatest touristic activity – mainly in part of the old city and around Passeig de Gràcia – with a resident-population density below the city average. This suggests a correlation between the concentration of touristic activity in certain areas of the city and the consequent displacement of the resident population to other neighbourhoods. This process also involves the development of different uses for housing in these areas.
By analysing the various factors considered for this map together, the areas of Sagrada Família and Barceloneta stand out, as they are in areas of medium to high touristic intensity while also having an above-average population density and being the scene of an elevated number of interventions by civic agents in public spaces, and in the case of Sagrada Família, also incidents concerning HUTs.
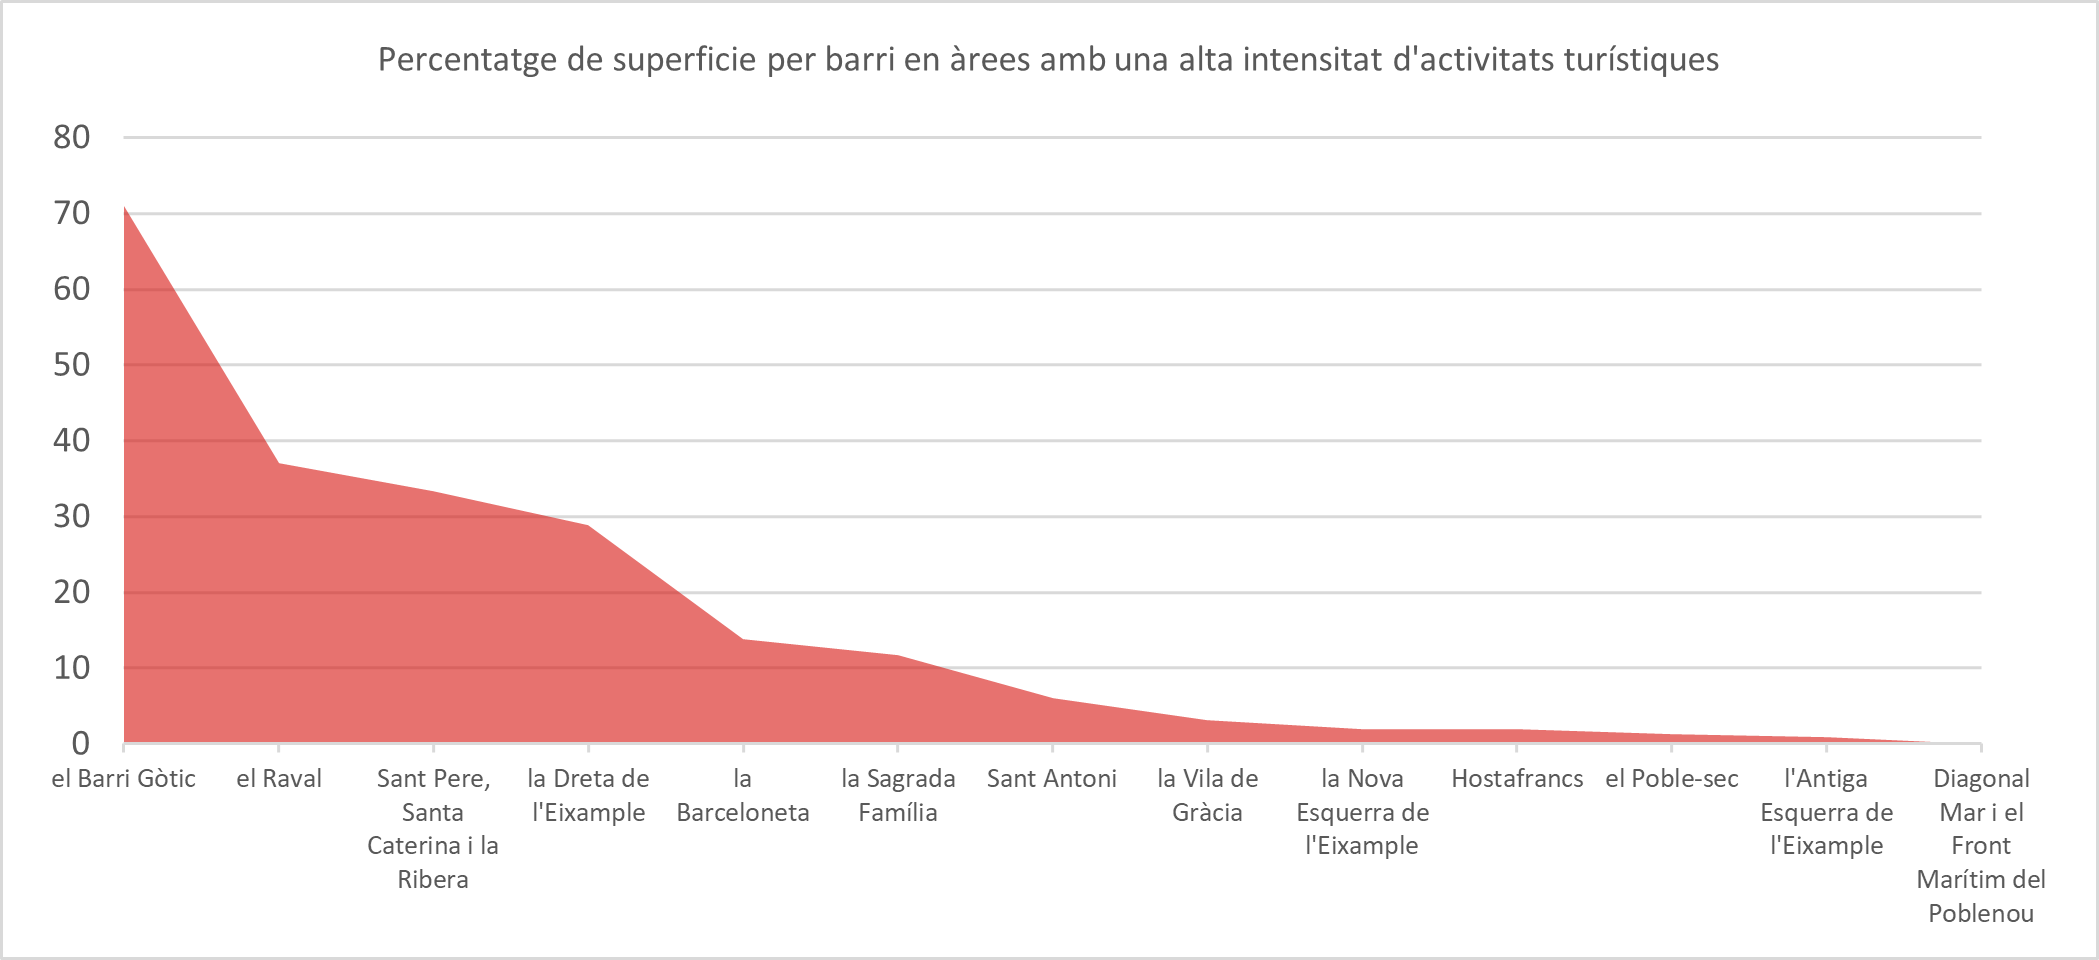
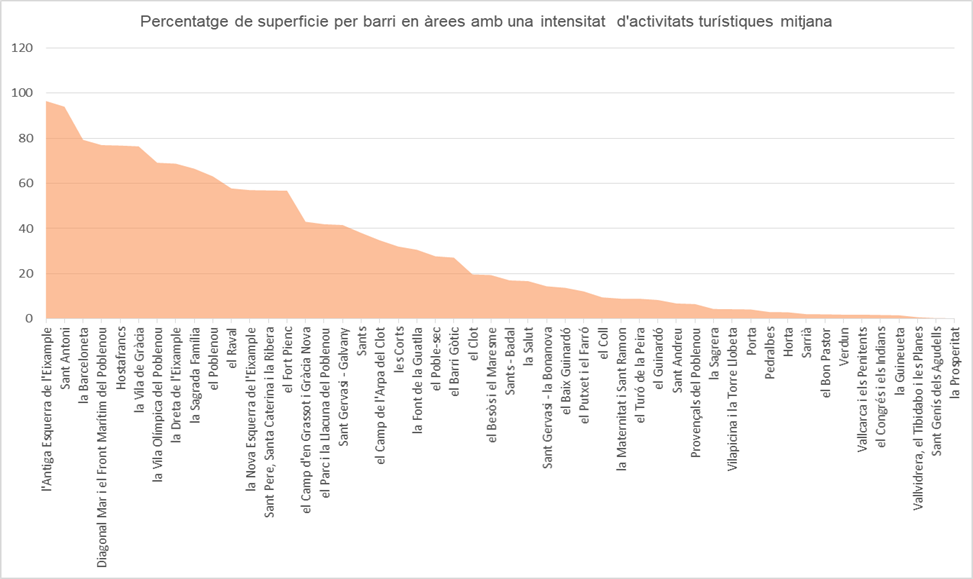
The area with high-intensity touristic activities mainly covers the city centre´s more ancient neighbourhoods, as well as Poble Sec and Barceloneta. The Barri Gòtic is the most affected, with 70% of its surface area inside this area, along with nearly all of its population (96%). The areas around Passeig de Gràcia, Sagrada Família, Plaça Espanya, Plaça de la Vila, Plaça del Sol and Plaça Revolució also stand out. In total, this area represents nearly 2.5% of the city’s surface area, and is home to 69,882 city residents.
According to data extracted from the general map for this analysis, about 512,775 people reside in areas of the city that have medium-intensity touristic activities, which represents around a third of the city’s total population. In terms of surface area, we can see that this area covers around 17.5% of the municipality, and mainly covers the central neighbourhoods of the Eixample and the neighbourhoods giving access to the beaches in Sant Martí.
Lastly, the city locations that registered the most interventions by civic agents from July to December 2018 include: Sagrada Família, Park Güell, the Montjuïc Magic Fountains and Barceloneta. The map also shows critical points with a greater number of incidents relating to HUTs (needing intervention by civic agents) from January to September 2019. These points are found in areas near Sagrada Família, Avinguda Paral·lel (the neighbourhoods of Poble Sec and Sant Antoni) and the area around the Rocafort metro station, which all have an above-average resident population density.
Effects on urban green spaces
The following map cross-references information about the levels of touristic intensity illustrated above (Barcelona Regional, 2019) and the distribution of urban green spaces in the city. The aim is to identify those green areas that are located in medium or high-intensity areas of touristic activity and which may therefore be subjected to greater use and their function for the resident population altered. In order to generate this second layer, the following databases were used:
- Urban green spaces. Parks, historic parks, city-block interiors and green squares (minimum vegetation cover >30% and permeable surface >40%). Barcelona Regional.
- Areas of the city classified as ‘Crowded Spaces’ (EGAs in Catalan) by Barcelona City Council’s Directorate of Tourism.
The city areas with a greater intensity of touristic activities overlaps with nearly 30% of the total number of green areas, equivalent to approximately 144 hectares. This preliminary picture allows us to identify six urban green spaces that are totally or partially located in high-intensity areas of touristic activity, with a total of nearly 3.2 hectares, representing 0.6% of the city’s urban green spaces. These areas are: Jardins de Rubio i Lluch, Plaça de Gaudi and Parc de Joan Miró, Plaça Vicenç Martorell, Plaça Vila de Madrid and Plaça de la Sagrada Família.
The following table shows exposure to the two intensity levels of touristic activity, broken down into types of urban green spaces and showing how nearly 60% of residential block´s internal courtyards are affected, followed by 50% of historic parks and 20% of the city’s parks and green squares.
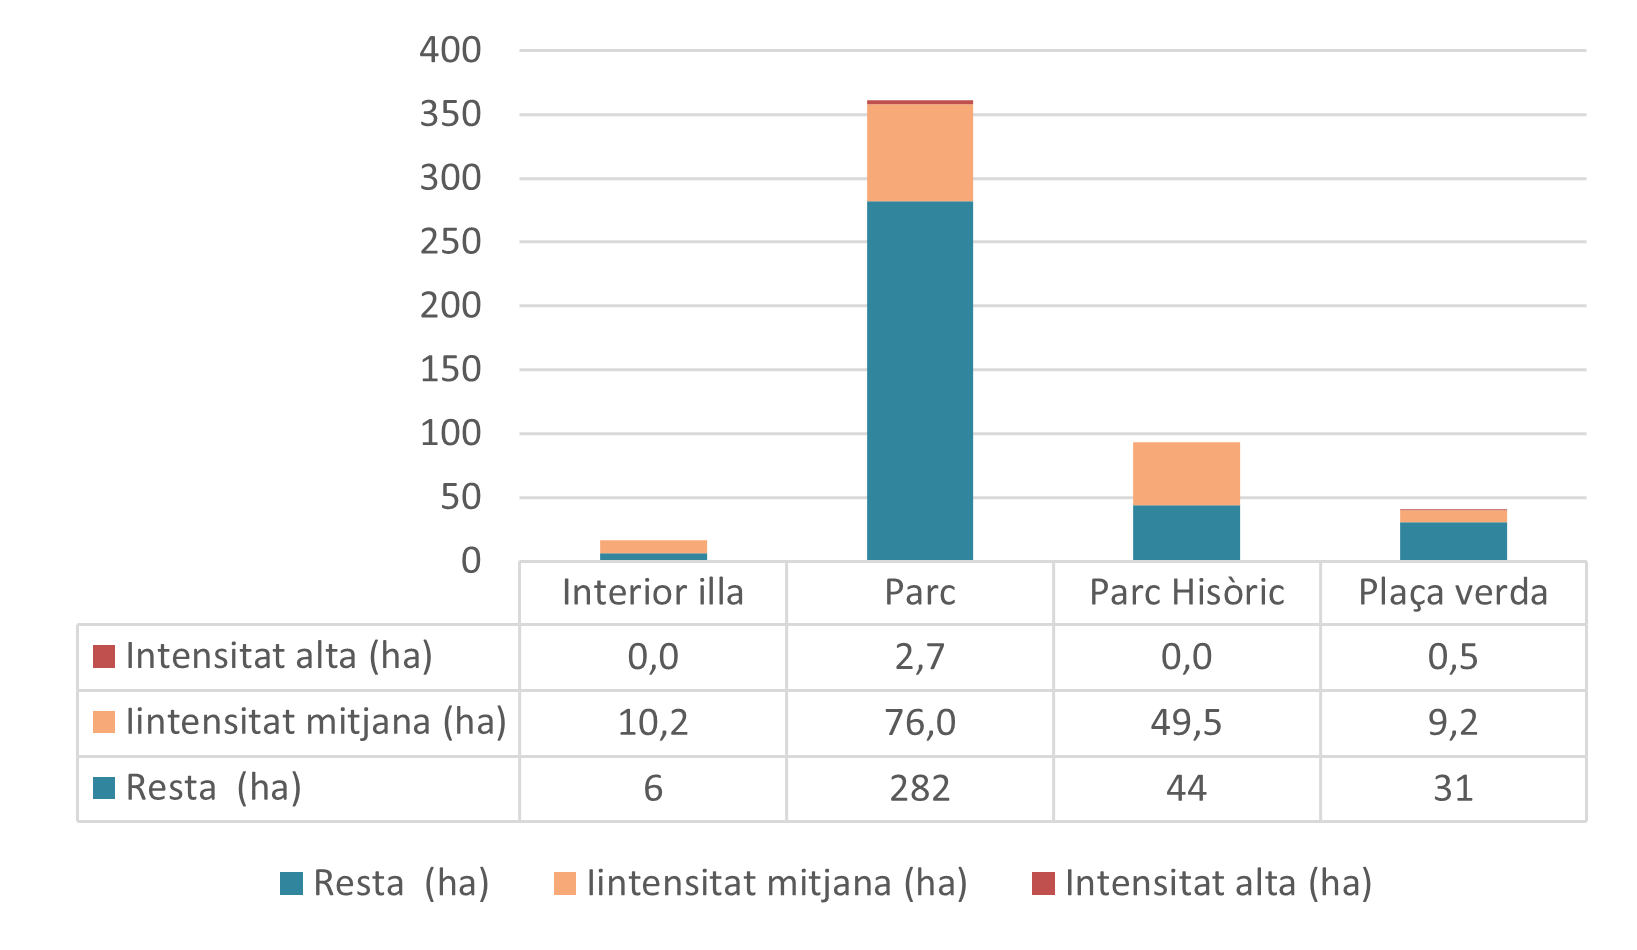
With regard to internal courtyards, the Eixample is particularly affected, as most of them are located in that district. these spaces play an important role in terms of the socio-environmental services they provide to this part of the city, where green spaces are scarcer. This district also presents the largest surface area (in hectares) of green squares affected by the phenomenon, equivalent to about 3 hectares shared among five spaces, including Plaça de la Sagrada Família, located in a high-intensity area of touristic activity.
The effect on the city’s historic parks is also striking. Nearly 50 ha in a total of ten historic parks coincide with medium-intensity areas. The affected parks include Parc de la Ciutadella and Park Güell, as together, they account for nearly 36 affected hectares and they are also in locations classified as Crowded Spaces (EGAs) by Barcelona City Council’s Department of Tourism.
In regard to parks, we can also see that nearly 76 ha, in a total of 29 parks, are in areas of medium or high-intensity touristic activity. 65% of those hectares pertain to 12 parks in the district of Sant Martí, mostly located around Passeig Marítim. We also highlight the Plaça de Gaudí park, which is subjected, in its entirety, to high-intensity touristic activities.
Effects on the metro, railway, bus and TRAM networks
The following map cross-references information about the touristic-intensity levels illustrated above (Barcelona Regional, 2019) and the public transport network formed by railways, metro, trams and buses. In order to generate this second layer, the following databases were used:
- Metro and FGC railway lines. Government of Catalonia 2019.
- Daily ticket validations at all metro and FGC railway stations. October 2016. FGC railway and Metro. 2016
- Streets with an above-average frequency of buses and trams. Barcelona Regional, based on TMB, AMB, Barcelona Regional Government of Catalonia data. 2018
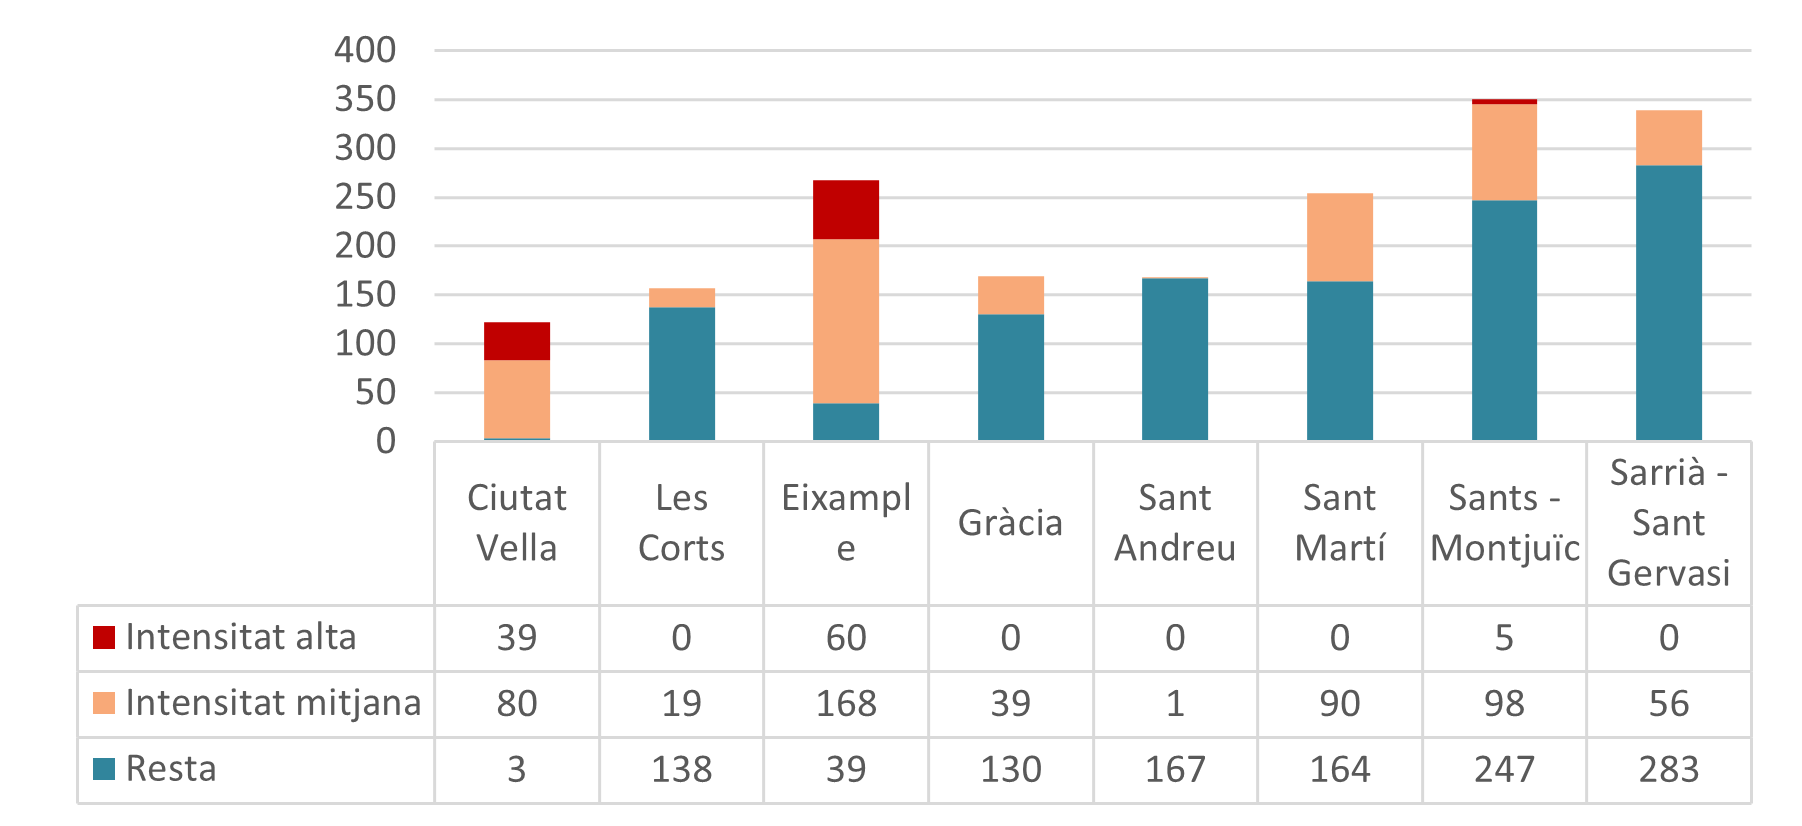
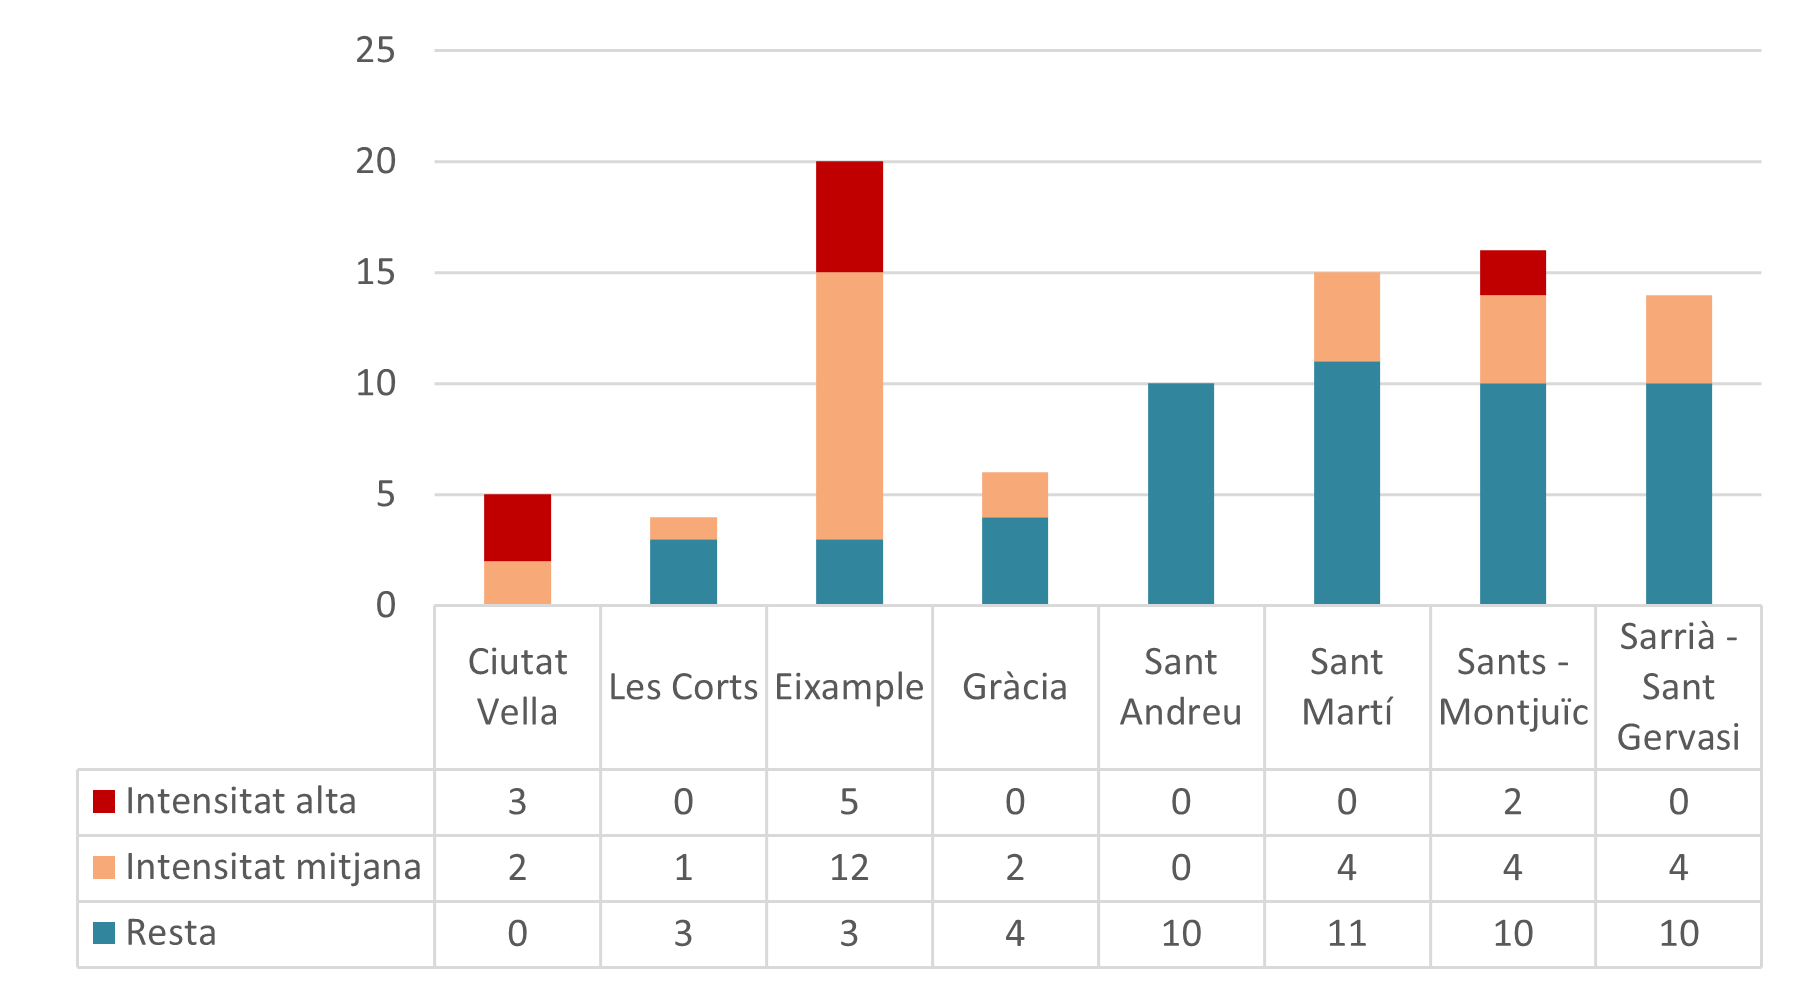
Superimposing the map of touristic-activity intensity onto the public transport network (metro, Government of Catalonia railways, bus and tram) shows that there are 10 metro stations located in high-intensity areas. Two of them are Metropolitan connections: Plaça Espanya and Plaça Catalunya – the latter with the highest number of daily ticket validations in the city (at around 10,000). The Sagrada Família and Diagonal metro stations also stand out, with 35,000 and 60,000 ticket validations a day, respectively (as mentioned in the introduction, you have to remember that these figures refer to the pre-Covid-19 situation, during which the demand for public transport – from both tourists and local residents – dropped by an average of 50%) . In regard to the bus and TRAM network, we can see that the lines with greatest frequency are those that provide services to the central part of the Eixample. This district also stands out for the number of high-intensity stops (32%), followed by Ciutat Vella (22%). Approximately 6% of all the bus stops in the city are high intensity.
In regard to medium-intensity areas, 29 metro stations are affected. Of these, Provença station (nearly 30,000 ticket validations a day), Hospital Clínic (nearly 25,000), and El Clot and Les Glòries (nearly 22,000) stand out. In regard to city areas with the greatest frequency of buses and trams, the most affected thoroughfares are Avinguda Diagonal, Gran Via and Via Augusta.
As we can see from the following tables (5 and 6), the most affected district is Ciutat Vella, where almost all of its bus and metro stops are affected, followed by the Eixample, with nearly 85% of all its bus and metro stops affected.
Tourist-use accommodation in areas with a higher intensity of touristic activities
As explained in the methodology for the intensity map for touristic-activity, tourist-use accommodation (HUTs in Catalan) is one of the weighted variables for calculating the areas of intense touristic activity. However, the percentage of HUTs per city block has been superimposed, in order to generate a map of the current situation, which can be compared with the situation when the 2017 Special Urban Planning for Tourist Accommodation Plan (PEUAT) was approved.
As shown on the map, most of the residential blocks that contain HUTs have a percentage of between 0.1% and 8% with respect to the total number of flats. To a lesser extent, the city blocks with a percentage of between 8% and 39% are mainly concentrated in the Dreta de l’Eixample neighbourhood, around Plaça Catalunya and Passeig de Gràcia. The city blocks with over 40% are very specific (four cases) and are located in the old part of the city, in Passeig de Gràcia and around the Sagrada Família. They coincide with high-intensity areas of touristic activity – or are located very close to them, and also with areas with a below-average resident population density, emphasising the development of different housing uses in these areas (see map in Appendix 5.1.1).
Related actions
The City of Barcelona has been implementing tourism promotion and management plans for over 25 years. However, the socio-economic conditions have changed and the city’s objectives now include new factors and new partners, which have been added to take part in defining the city’s tourism strategy.
In recent years, initially as part of the 2020 Barcelona Tourism Plan and currently as part of the 2020 Government Measure for Creating new Ideas and Content for Improving Mobility and Touristic Sustainability, the focus has been on producing management instruments that foster the best possible relationship between touristic activity and city, by means of the following mechanisms: ensuring social return from tourism in the territory, promoting integrated management and building differentiated strategies within the territory. The main aim of this government measure is to define an action plan concerning tourist mobility for the coming years, creating new visions of tourism and defining management scenarios that will help to administer the tourist influxes that the city receives, in order to diversify their socio-economic contribution, reduce negative impacts on crowded spaces and help to foster Barcelona residents’ pride and knowledge about their own city.
As mentioned in the introduction, these transformations have been drastically interrupted by the Covid-19 crisis, as the economy of the sector has been widely affected, while any possible scenarios for recovery are uncertain.
The Barcelona Resilience Programme is an opportunity to conserve the long-term vision of touristic activity and to promote the reactivation of the sector on a Metropolitan scale, progressing towards an integrated management of tourism that achieves a more socially equitable distribution and respects environmental criteria in its development. In this regard, promoting measures such as expanding Barcelona’s real touristic perimeter, specific management of the city’s Crowded Spaces, broadening touristic visions, maximising the efficiency of tourist mobility and continuing to minimise tourism’s impact on the housing market and the everyday lives of city residents may become key factors for achieving this objective. The challenges arising from the Covid-19 crisis may represent an unprecedented opportunity for implementing corrective measures and developing a more inclusive and sustainable touristic model for the city’s communities, economy and environment.