Introduction
The slow recovery of wages in the wake of the financial crisis and the progressive increase in rental and purchase prices since 2014 have been fuelling a growing gap between household income and the cost of housing in Barcelona, with significant differences in terms of territory, demographic profile and type of tenancy.
In the years of the housing boom (1996-2007), favourable credit conditions facilitated access to home ownership through mortgages, shifting the affordability problem to household indebtedness. Meanwhile, the currently less favourable credit rates, together with the greater precariousness of employment in recent years, have lead to more vulnerability in the rental system. The greater vulnerability of individuals who live in rental households compared to those who own their property outright was also dramatically highlighted during the Covid-19 pandemic, with direct consequences on their ability to maintain adequate housing conditions.
The financial strain brought about by fixed housing-related expenses not only reduces the amount of resources that people living in rental households have to cover other basic needs such as food, education and health, but also impacts on their ability to cope with unforeseen circumstances such as a sudden reduction in income or even job loss - eventualities that were commonplace during the first months of the pandemic. A survey carried out by the Observatori Metropolità de l’Habitatge (OHB) in May 2020 during the first two weeks of home lockdown showed that 57.6% of people living in rental households saw a worsening of their economic situation as a result of the pandemic, compared to 44.9% of individuals who are currently paying a mortgage and 31.7% of people who already own their property outright (Observatori Metropolità de l’Habitatge Survey of inhabitants during the 2020 lockdown).
The same patterns of inequality are reflected in the different levels of household income by tenancy status: €1,970 for renters, €2,780 for people paying a mortgage and €2,580 for those who own their property outright.
Risk factors
What percentage of income makes rentals considered unaffordable?
The indicator used at the European and international level to assess the affordability of housing is the Housing Affordability Index, expressed as the percentage of household income that is set aside for paying rent/mortgage/home owner fees (depending on tenancy status) and basic utilities. The indicator represents the financial strain that households are subjected to on a monthly basis to pay their rent.
The Observatori Metropolità de l’Habitatge (OHB) estimates that people living in rented accommodation allocate 43% of their monthly income to housing-related expenses (2018). This is 3 percentage points above the affordability threshold defined by Eurostat (40%) and 13 percentage points above the amount suggested by the United Nations in its Sustainable Development Goal number 11, which sets the threshold at 30%. If they are paying more than this figure, they are, according to the UN, under excessive financial strain for housing-related expenses, including basic utilities (water, electricity and gas).
Vulnerable areas
Parts of the city where it is least affordable to rent
The following maps seek to reflect this indicator on different territorial levels - on the neighbourhood and district levels - for the years 2016 and 2017. This allows us to draw comparisons and see how the statistics evolve over time. By extending the historical series of analysed data, it is also possible to identify the trend.
The first map uses data on average household income per district (Atlas of household income, INE - 2016) and average rent al price per district (average deposit according to INCASOL for the same year); the second map depicts data on average household income per census section (Atlas of household income, INE - 2016), and average rental price per neighbourhood (average deposit according to INCASOL for the same year).
The average household expenditure on basic utilities (water, gas, electricity) is also added to the household income figures. Since the average utility expenditure varies according to household size and consumption patterns but does not change from territory to territory, a standard value is indiscriminately added to the average rental contract recorded for each neighbourhood, even though we are aware that this value could vary significantly between households. The calculation of average utility expenditure (€1,476/year) was obtained from a study carried out by the private consultancy firm DALEPH on behalf of the Barcelona City Council in 2016.
The following map reflects this indicator on a district level for the years 2016 and 2017. By selecting the year, the map alternately shows the evolution of rental affordability for the two years in question, and the difference between them.
The following map reflects this indicator in various territories for the years 2016 and 2017, breaking it down at the neighbourhood and census section levels. An additional layer of data on the estimated density of rental housing in each neighbourhood was added to the rental affordability index calculated per census section (Barcelona Sociodemographic Survey, 2017). This information not only allows us to highlight the neighbourhoods where rental properties are least affordable, but it also gives us an idea of the number of households in vulnerable situations.
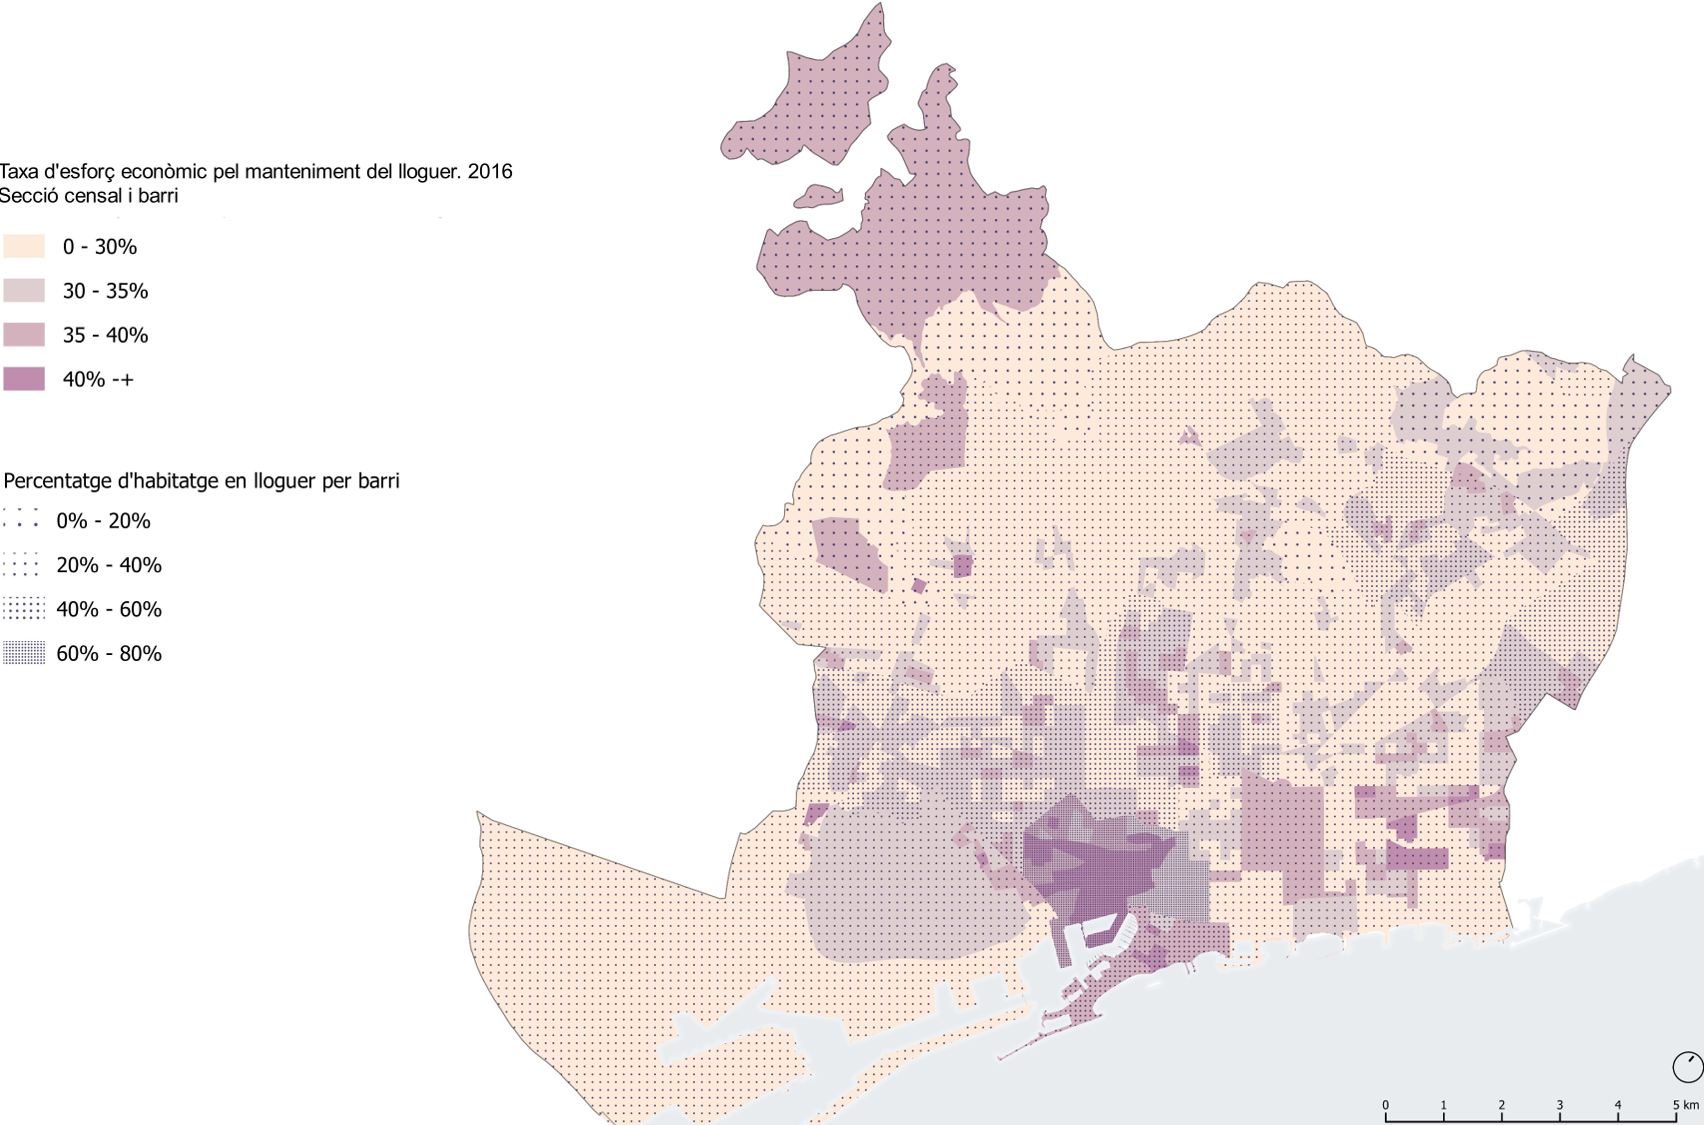
The district with the least affordable rental prices is Ciutat Vella, where in 2017 those living in rented accommodation allocated, on average, 40% of their income to paying rent, with basic utilities on top. This is 10 percentage points above the threshold recommended by the United Nations (30%), equalling the unaffordability threshold defined by Eurostat (40%).
The greater levels of vulnerability in Ciutat Vella are also highlighted by the fact that most of the housing stock in its various neighbourhoods corresponds to rental properties: in Raval, 60-80%; in the Barri Gòtic, 60-80%; in Barceloneta, 40-60%; in Sant Pere, Santa Caterina i la Ribera, 60-80%. This means a considerable number of households at risk of residential exclusion as a result of excessive spending on living costs.
As shown in the maps, other neighbourhoods with high levels of rental properties that are deemed unaffordable can be found in Poble Sec (35%), Diagonal Mar i el Front Marítim del Poblenou (39%) and Provençals del Poblenou (35%); however, these three have a lower percentage of rental households, corresponding to 20-40% of the total amount.
The districts where the largest growth was recorded in the difference between household income and rental cost between 2016 to 2017 were Sarrià-Sant Gervasi, Les Corts and Sants-Montjuïc. While the first two districts have the highest levels of average household income anywhere in the city (€53,800 and €43,800 per year, respectively, corresponding to less financial strain), there was a substantial increase in this indicator in Sants-Montjuïc, increasing from 35% to 40% of the average household income between 2016 and 2017.
Related actions
The risks and vulnerabilities analysed in this paper threaten the resilience of the city and its neighbourhoods, with different levels of criticality and impact by population size. The Barcelona Housing Rights Plan (2016-2025), and the political commitment derived from it, offer an ambitious strategic framework for addressing the challenges that are currently facing the city. Through it, the City Council seeks to implement a wide range of measures, projects, actions and regulations - both to support demand and the supply of new housing - that have a key role to play in guaranteeing the universal right to housing throughout the different stages of life.
The following ongoing and future actions aim to increase the size of the affordable public housing stock to make households more affordable in the different neighbourhoods.
Barcelona City Council plans to increase the city's public housing stock by more than 4,600 homes through the promotion of new subsidised housing: both rental accommodation (80% of the total) and those with rights of surface (20% of the total).
In December 2018, Barcelona City Council and the Regional Government of Catalonia passed an amendment to the General Metropolitan Plan (PGM) to allocate 30% of new developments and large private sector rehabilitations to subsidised housing (VPO). This 30% will apply to any building permit over 600 m², and must be applied in the same neighbourhood as the building development. Particular importance is given to the more central neighbourhoods under the greatest threat of property speculation, which is also highlighted in the maps. This measure is expected to increase the city's affordable housing stock by around 330 flats per year, which will be deemed affordable to 75% of households.
Since 2017, the City Council has also been promoting various initiatives aimed at expanding the stock of affordable housing in a rapid and evenly-distributed manner throughout the city through incorporating private housing in public programmes. Two such examples are the Borsa de Lloguer and the Programa de Cessió.
Last, throughout 2018, the Observatori Metropolità de l’Habitatge (OHB) - a supra-municipal body funded by the different administrations and responsible for raising awareness of the housing market in the 36 municipalities of the Barcelona Metropolitan Area - has been fine-tuning its system of indicators to provide the different administrations with all the information, data, studies and analyses they may need when promoting public housing policies aimed at improving affordability.
The Programa de Resiliència de Barcelona (Barcelona Resilience Programme) represents a new opportunity to highlight efforts to implement existing and new measures to improve access to housing for all people at different stages of their lives.