Introduction
According to figures produced by the European Environment Agency (EEA), Barcelona and its metropolitan area make up one of the urban environments with most populations exposed to high levels of noise pollution in Europe. That is largely due to its mixed, compact city model, which has many advantages in terms of service management and efficiency but also some externalities and inconveniences, for example, noise, as a result of the high level of mobility associated with it, the density of economic activities and even the intensive use of public spaces.
Historically, noise has been regarded as a secondary problem, inevitable in large urban centres. However, the latest studies by the World Health Organization (WHO) and the EEA clearly show the impact that noise pollution has on people’s quality of life. In that regard, many epidemiological studies warn of the relationship between exposure to noise pollution (in the short and long terms) and its effects on health, negative impacts mainly on the hearing mechanism, sleep (such as insomnia), life functions (leading to premature ageing of the cardiovascular system) and the nervous system.
Currently, one in five Europeans are exposed to noise levels that are harmful to health. That translates into 12,000 premature deaths and 48,000 new cases of cardiac ischaemia (tightening of the arteries) a year, 22 million people who suffer chronic pain and more than 6 million who suffer serious and permanent alterations in their sleep which could be due to noise pollution (EEA, 2020). Unfortunately, future forecasts point to an increase in the population exposed to this risk, compared to other stress factors.
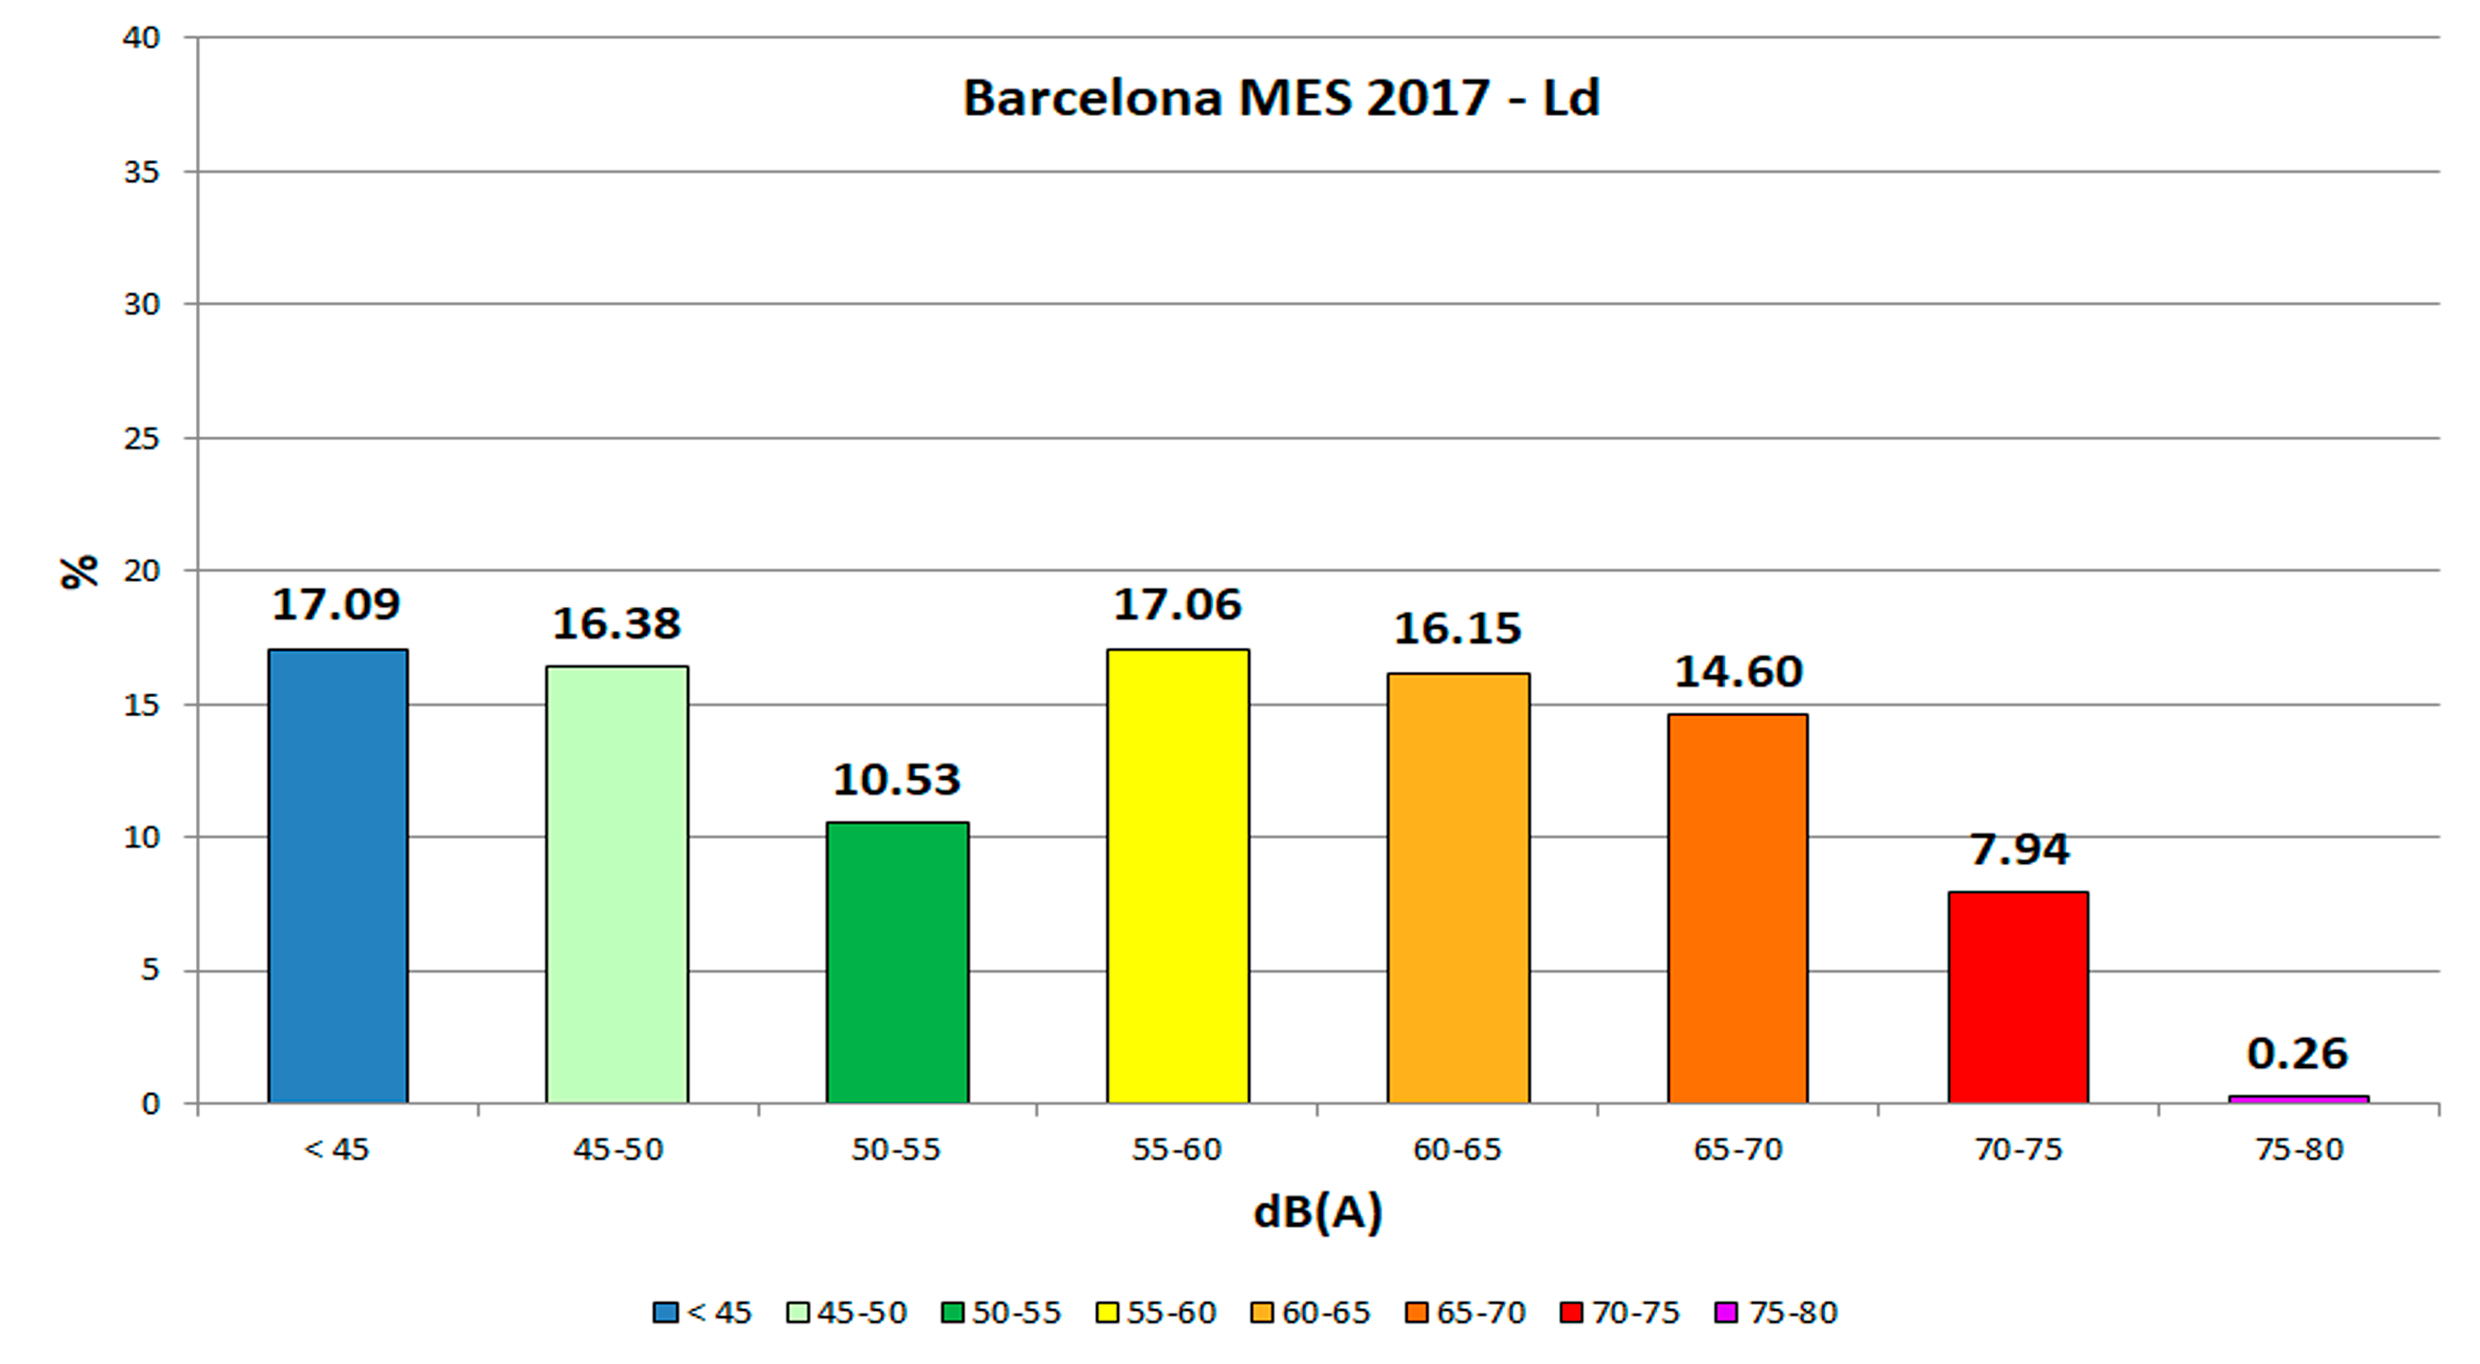
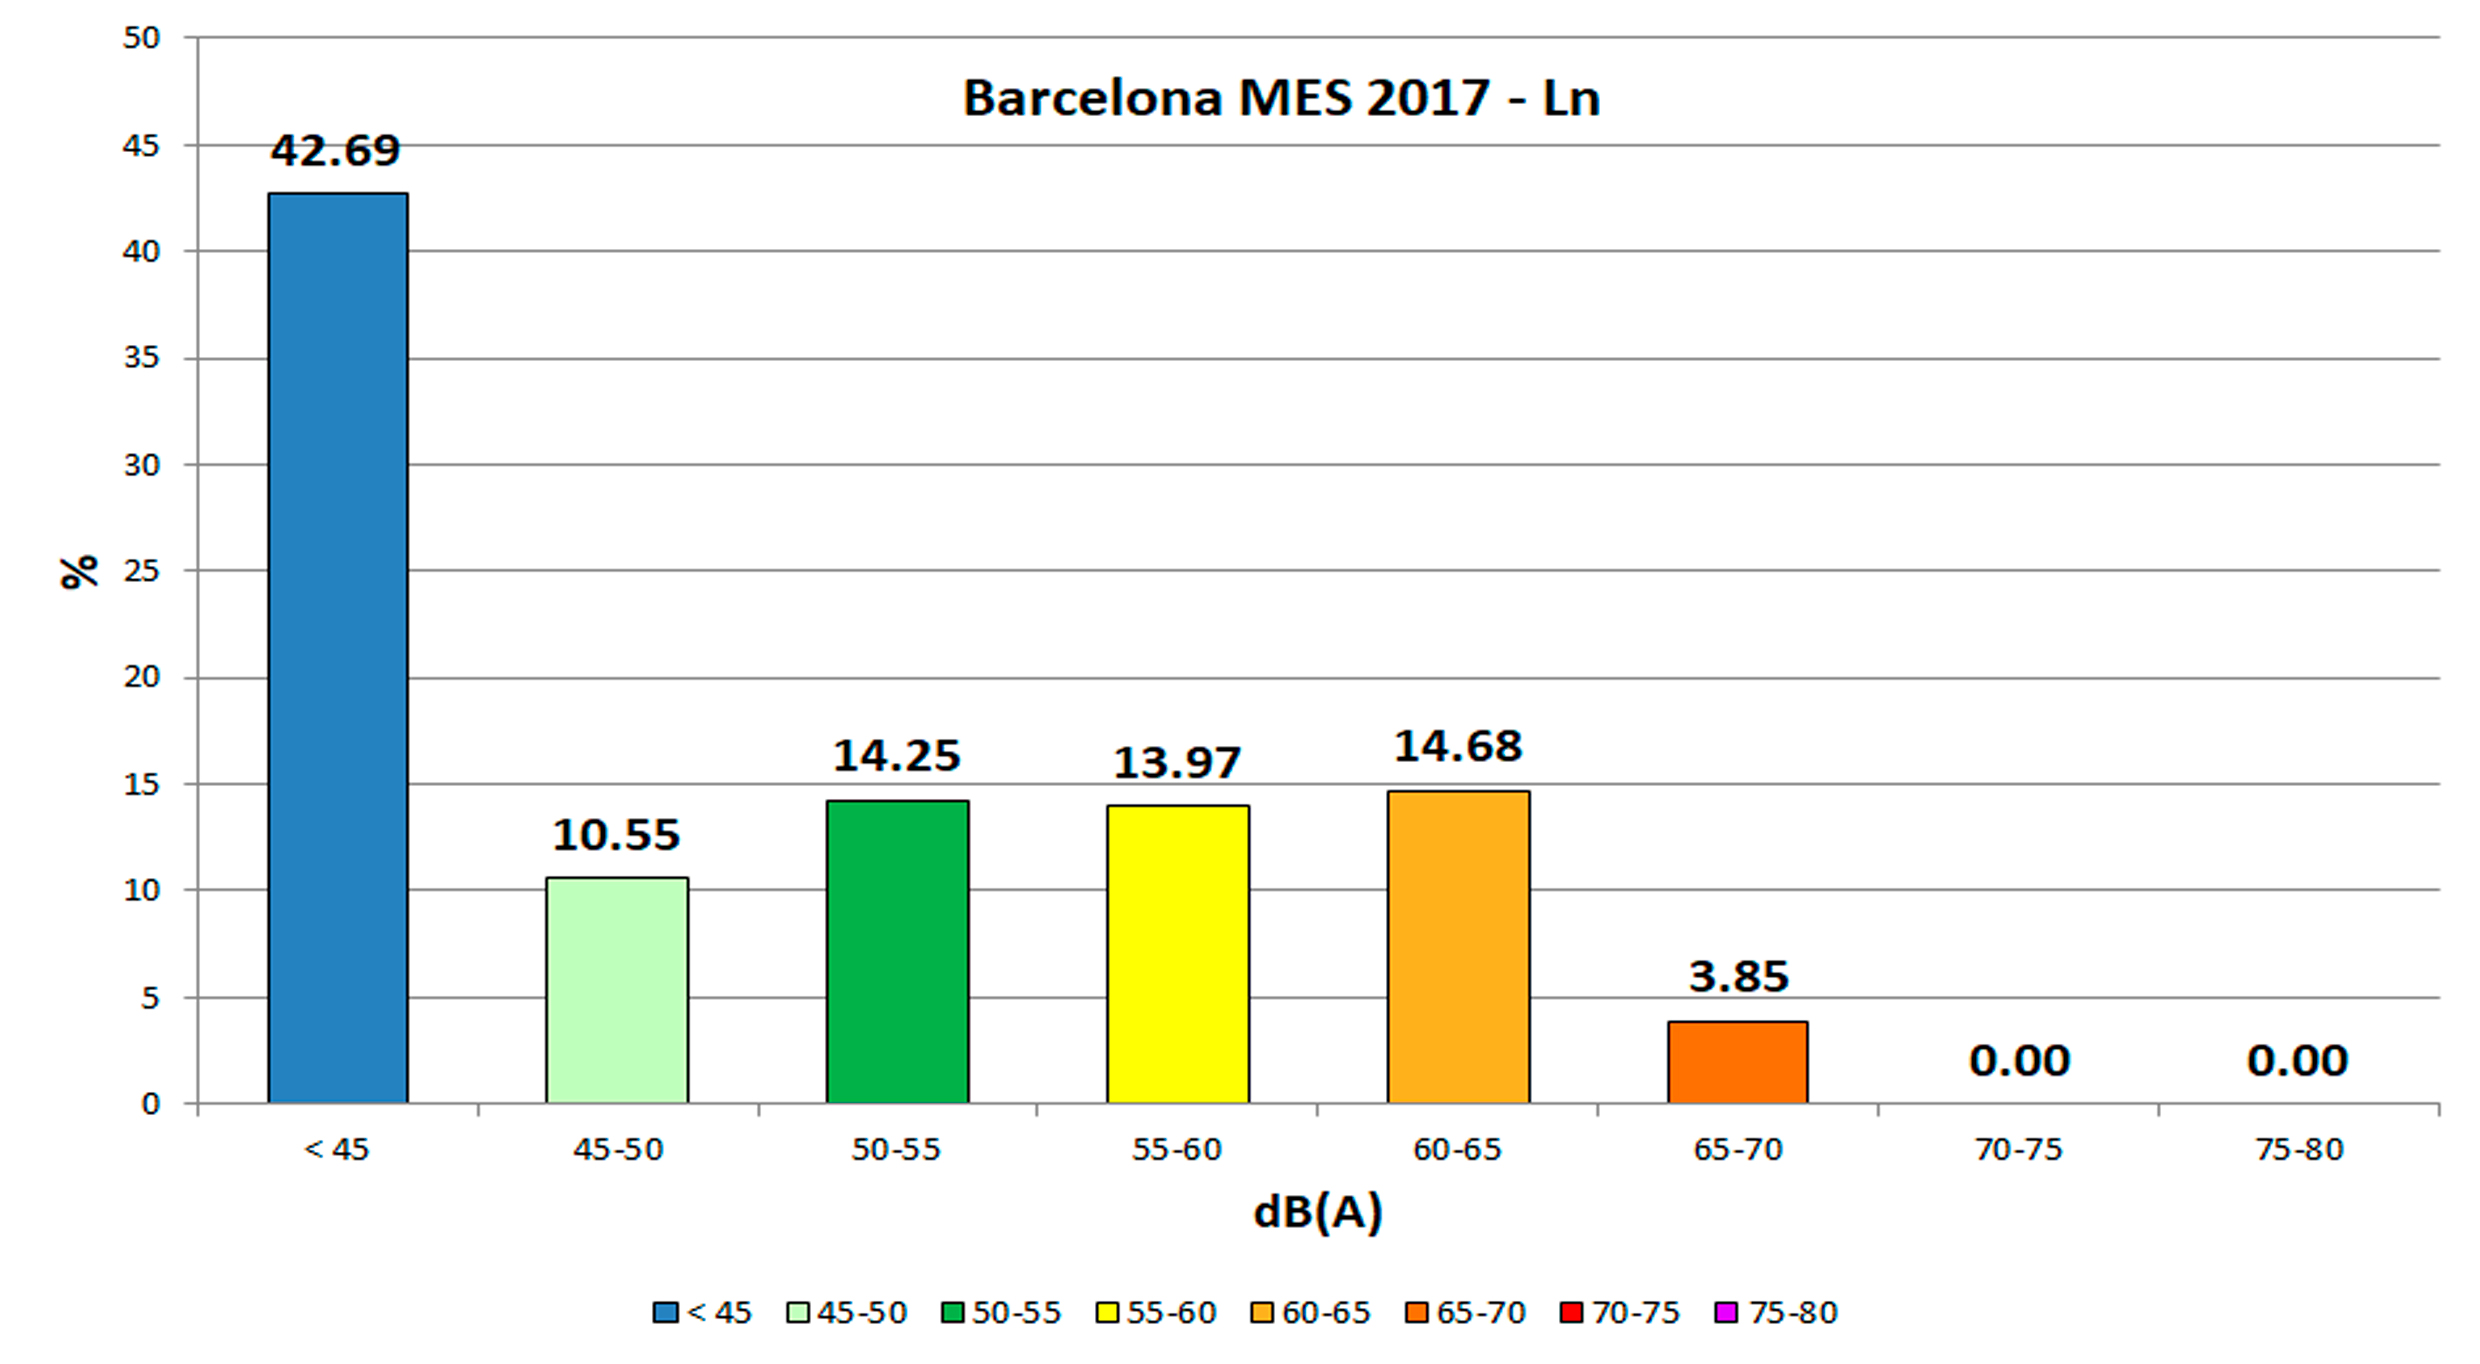
As in the vast majority of cities, the main source of noise in Barcelona is road traffic, which contributes to approximately 85% or more of exposure to noise. The other sources, a long way behind, are night-time leisure, which does not even contribute 10%, and rail or industrial noise which are much more occasional (below 2%). The result of all those sources is that during the day the predominant noise ranges in Barcelona are between 55 and.70 dB(A), while at night they are between 50 and 65 dB(A).
It is worth noting that the population’s perception of noise is very different to this, as reflected in the complaints made regarding public spaces in Barcelona in 2019. What stands out above all are the complaints relating to crowds of people, festivities and sports events in public places, the cleaning and refuse collection service, commercial and industrial activities, and the noise from terraces or pergolas. Complaints relating to road traffic, on the other hand (the main source of noise), are few and far between. The reason for this is largely due to the fact that traffic noise is constant and that, psychologically, many people consider it to be unavoidable in an urban environment.
Noise pollution
Establishing a noise cap value on the basis of which we have poor acoustic quality is a complex task, and different public authorities and bodies have different criteria for defining it. In contrast to air quality, there are no established European-level limits or criteria. Instead, each city, region or country decides what its appropriate limits are. In Barcelona’s case, the noise limits are defined by the Environment Byelaw, which also includes the requirements set by higher-level authorities: the Catalan and Spanish governments.
In that regard, the Barcelona Environment Byelaw establishes various immission limit values (annual means) depending on the noise sensitive areas, the predominant land uses and the time of day, as shown in the following table:
| NOISE SENSITIVE AREAS AND LAND USES (*) | Ld | Le | Ln |
| (7am-9pm) | (9am-11pm) | (11pm-7am) | |
| HIGH NOISE SENSITIVE AREA (A) | |||
|---|---|---|---|
| (A1) Spaces of natural interest and others | - | - | - |
| (A2) Predominantly land used for health, teaching and cultural purposes (*) | 55 dB(A) | 55 dB(A) | 45 dB(A) |
| (A3) Housing in a rural environment (*) | 57 dB(A) | 57 dB(A) | 47 dB(A) |
| (A4) Predominantly land used for residential purposes (*) | 60 dB(A) | 60 dB(A) | 50 dB(A) | MODERATE NOISE SENSITIVE AREA (B) |
| (B1) Land for residential use next to existing activities or transport infrastructures | 65 dB(A) | 65 dB(A) | 55 dB(A) |
| (B2) Predominantly land used for tertiary purposes other than C1 uses (*) | 65 dB(A) | 65 dB(A) | 55 dB(A) |
| (B3) Existing urbanised areas affected by land for industrial use | 65 dB(A) | 65 dB(A) | 55 dB(A) | LOW NOISE SENSITIVE AREA (C) |
| (C1) Recreational and entertainment uses (*) | 65 dB(A) | 65 dB(A) | 55 dB(A) |
| (C2) Predominantly land used for industrial purposes (*) | 70 dB(A) | 70 dB(A) | 60 dB(A) |
| (C3) Areas affected by general transport infrastructure systems or other public facilities | - | - | - |
Ld, Le i Ln = noise immission indices for the day, evening and night-time periods evaluated over a year.
In land uses (A2), (A4), (B2), (C1) and (C2), the immission limit value increases by 5 dB(A) for existing urbanised areas.
There are no immission limit values for land uses (A1) and (C3), but in any case efforts will be made to ensure the levels reflected on the noise map in force are not exceeded.
In block interior courtyards, ventilation wells, land plot courtyards and spaces not accessible to vehicles, the noise quality targets are 60 dB(A) in the daytime and evening and 50 dB(A) at night.
On the other hand, the WHO has recently published a guide which establishes the recommended thresholds for health, and this recommends not exceeding the Lden and Ln limits of 53 dB(A) and 45 dB(A), respectively. Put very simply, the Lden could be compared to the maximum ‘dose’ of noise that the population should be exposed to during 24 hours, while Ln only refers to night-time. The latter is the most sensitive from a health point of view, as noise can have adverse effects on sleep and ageing of the cardiovascular system.
It should be pointed out that the levels recommended by the WHO (both the Lden at < 53d B(A) and Ln at < 45dB(A)) are significantly lower than those established by most regulations, and Barcelona is not an exception. Indirectly, this shows us that the usual noise pressure level in urban environments is very high.
Broadly speaking, the Barcelona regulation establishes a limit of 65 dB(A) during the daytime and 55 dB(A) at night in predominantly residential areas. The WHO, on the other hand, believes that, from 53 dB(A) during the Lden period (i.e. 24 hours) and from 45 dB(A) at night, we are talking about poor noise quality with an effect on health. Given this difference between the regulatory criteria and those of the WHO, an intermediate noise limit between the two options has been used for this study: 60 dB(A) in the daytime and 50 dB(A) at night..
Risk areas
Daytime noise levels
The daytime noise pollution map enables us to see how most city streets are over the noise limit of 60 dB(A). Poor noise quality is one of the most important problems facing Barcelona, although it is more serious in some parts of the city than in others. The Eixample neighbourhoods are the ones that show the highest levels, as their layout (broad streets with several lanes) mean they attract and absorb traffic. The same happens with Barcelona’s main roads which have a high vehicle capacity and are used to enter and penetrate the city.
Night-time noise levels
Just like daytime, night-time reflects the correlation between volume of traffic and noise level. However, the night-time leisure sector also shows it has a significant impact in various parts of the city. As during the daytime, Eixample is the area with the most night-time noise pollution and traffic continues to dominate the spatial distribution of noise. That said, if we put the magnifying glass over the neighbourhoods and streets where night-time leisure has a high presence, we can identify other critical points that do not appear on the day map, especially in the Gothic Quarter, the Gràcia neighbourhood and Poble-sec.
The map presents the distribution of day and night-time noise pollution by stretches of road. We recommend you select one layer at a time (day or night) to observe the different day and night-time noise levels in the city.
Where is the most vulnerable population found?
The Barcelona City Council Strategic Noise Map compiles total noise levels, which are the result of noise pollution caused by traffic (the main source of noise), night-time leisure, industry, railways and crowds of people.
In order to link this territorial-based information with the population data from the residents’ register (2018), an estimate has been made of the number of people registered in each of sections and that has been crossed with the noise information from the Strategic Noise Map by road or street sections. This has enabled us to obtain the size of the population exposed to the noise levels (Illustration 1) and produce the risk maps from there.
Delimitation of the most critical points
The relationship between the street section’s population and length is, de facto, an alternative way of expressing population density. It is based on the same concept used in the orthodox calculation of population density (obtained by dividing the number of inhabitants by the surface area) but using the geometric dimension of a line instead of a polygon.
However, it is important to specify that the question ‘Where is the most vulnerable population found?’ cannot have a single answer because the population moves around depending on the time of day, their work and their free-time activities. Therefore, it has to be borne in mind that we are talking about maps which need to be interpreted on a large scale and that the risks have to be contextualised globally.
Exposure to noise during the day
By comparing the spatial distribution of noise levels with the resident populations, we see that there are wide areas with a high concentration of inhabitants and dB(A) levels over the established limit. One of the areas where the situation is most serious is the Sagrada Familia and its surrounding neighbourhoods. This is an area with a high population density where two accompanying factors come together: crowds of tourists and the volume of traffic.
The neighbourhoods that comprise Esquerra de l’Eixample show a worrying intersection between the size of the population and high noise levels. The case of Carrer d’Aragó in particular stands out, as the constant traffic produces noise levels in excess of 75 dB(A) in some sections, a figure way above that recommended by the regulations.
It is estimated that traffic is causing approximately 80% of noise in the city. Consequently, it is precisely those areas with the most traffic that register the highest noise levels. We can see how most of the Eixample streets with a river-to-river orientation exceed the 70 dB(A) threshold as they are part of the basic structure of city mobility. The other roads above the threshold are those that allow vehicles to enter the city and cross it.
On the River Llobregat side, Carrer de Sants and Avinguda de Madrid stand out. In the central part of the city, Muntaner, Aribau and Balmes are streets that also suffer high levels, as they connect the centre with the Ronda de Dalt ring road. The same happens with the roads that link Plaça de Lesseps with access points to the Ronda del Camp de l’Àliga. On the River Besòs side, Av. de la Meridiana and Gran Via are the most critical points.
Inevitably, other high vehicle-capacity road, such as the ring roads or the top end of Av. de la Diagonal also have high noise levels but the low concentration of residents means their sections do not feature as prominently on the map.
On the other hand, we see how a large part of the city is found in the 65-70 dB(A) band. Such is the case with most of the Eixample streets with a sea-mountain orientation and even many of the streets which, despite having fewer lanes, are used to cross the neighbourhoods formed by the city’s old quarters. By way of example, we could give Carrer Gran de Gràcia, Carrer de l’Hospital or Carrer de Galileu.
El mapa representa el risc d'exposició a diferents nivells de contaminació acùstica a la ciutat
Els valors expressats s'han relativitzat en funció de la longitud del tram, mentres que es fa servir el gruix de la línia com a indicador de la proporció resultant (a major gruix, major proporció d’habitants per metre de tram de carrer).
Exposure to noise at night
As the Strategic Noise Map has shown previously, the impact of night-time noise pollution due to traffic coincides closely with the equivalent daytime image. In that regard, the Eixample continues to be an area with a high exposure and a large number of road or street sections with high noise levels, between 65 i 70 dB(A).
That said, if we focus on the neighbourhoods and streets where night-time leisure has a high presence, we can identify other critical points that do not appear on the day map. To give a few examples, we could point to Carrer d’Escudellers and the area round Plaça Reial in the Barri Gòtic. In Gràcia, Plaça de la Vila, Paça del Sol and Carrer del Torrent de l’Olla are some of the hotspots. In Poble-sec, Carrer de Blai, a pedestrianised street, also registers high noise levels due to the number of bars and restaurants with a terrace.
Finally, it can be seen that the vast majority of streets outside Eixample are between 50 and 60 dB(A). Bearing in mind that the whole of the Eixample district has higher noise levels, this image helps us to see the expansive nature of the problem of noise in the city at night: practically all the streets are above the established limit.
The map represents the risk of exposure to different levels of noise pollution in the city. The values have been relativised depending on the length of the section, while the thickness of the line is used to show the resulting proportion (the thicker it is, the higher the proportion of inhabitants per metre of street section).
Related actions
All the measures seeking to reduce the density of vehicles circulating on the city roads with high traffic density will play a key role in reducing the resident population’s high exposure to noise. Barcelona City Council has been working for years now to improve the city’s noise quality, but this is an environmental problem which requires a change in the mobility model or in the use of public space for it to be solved. The high percentage of the population exposed to average pollution levels poses the need to continue working on pacifying the public space, principally by means of improved urban planning (in the design of block interiors, superblocks), better infrastructures (rail and road arteries) and reducing traffic during daytime, while pushing for control of night-time leisure activities, as provided for in the 2010-2020 Plan for Reducing Noise Pollution or the Urban Mobility Plan.
The main measures implemented recently to improve environmental quality, including air and noises pollution, includes restrictions on the circulation of the most polluting vehicles, which declare 95 square kilometres of the city as a low emission zone (LEZ, or ZBE in Catalan). The ZBE and another set of mobility management and planning measures in Barcelona, such as regulated parking, promoting public transport and cycling, pressing ahead with electric vehicles and the changes in the city model, are intended to set the political agenda with structural initiatives that have a positive impact on health and the environment.
In addition, the new Urban Mobility Plan (2019-2024) – currently being drafted – proposes a paradigm shift in the mobility model in line with its predecessor, namely, to encourage journeys on foot, by creating safe and convenient spaces for pedestrians, as well as by sustainable means of transport (bicycles and public transport). At the same time, it proposes to reduce the use and presence of private motor transport (cars and motorbikes). The plan’s main focus is to achieve safe, healthy, sustainable, smart and equitable mobility.
With regard to controlling leisure activities, there are some factors that intensify today’s challenges: greater awareness of the impact of noise on smokers in public spaces and increasing tourist activity in certain parts of the city. Promoting civil behaviour is key in that regard. Awareness campaigns targeted at night-time leisure users and the general public, together with the educational programme ‘Sssplau’ (Shsh please) in schools, help towards achieving this. The new 2020-2030 Plan for Reducing Noise Pollution which is being drawn up now incorporates all these lines and aims to work on all these noise sources in order to improve people’s health and the overall quality of public spaces in the city.
The Barcelona Resilience Programme is a new opportunity to highlight the effort being made to implement structural measures that tackle noise pollution. Among the opportunities identified, actions planned to discourage the use of private vehicles stand out. These include converting a further 200 kilometres of streets to a 30 kph limit, drafting a plan for mobility on foot and improving road safety in school environments in the city.