Back to top

Increasingly hotter weather will have direct effects on health

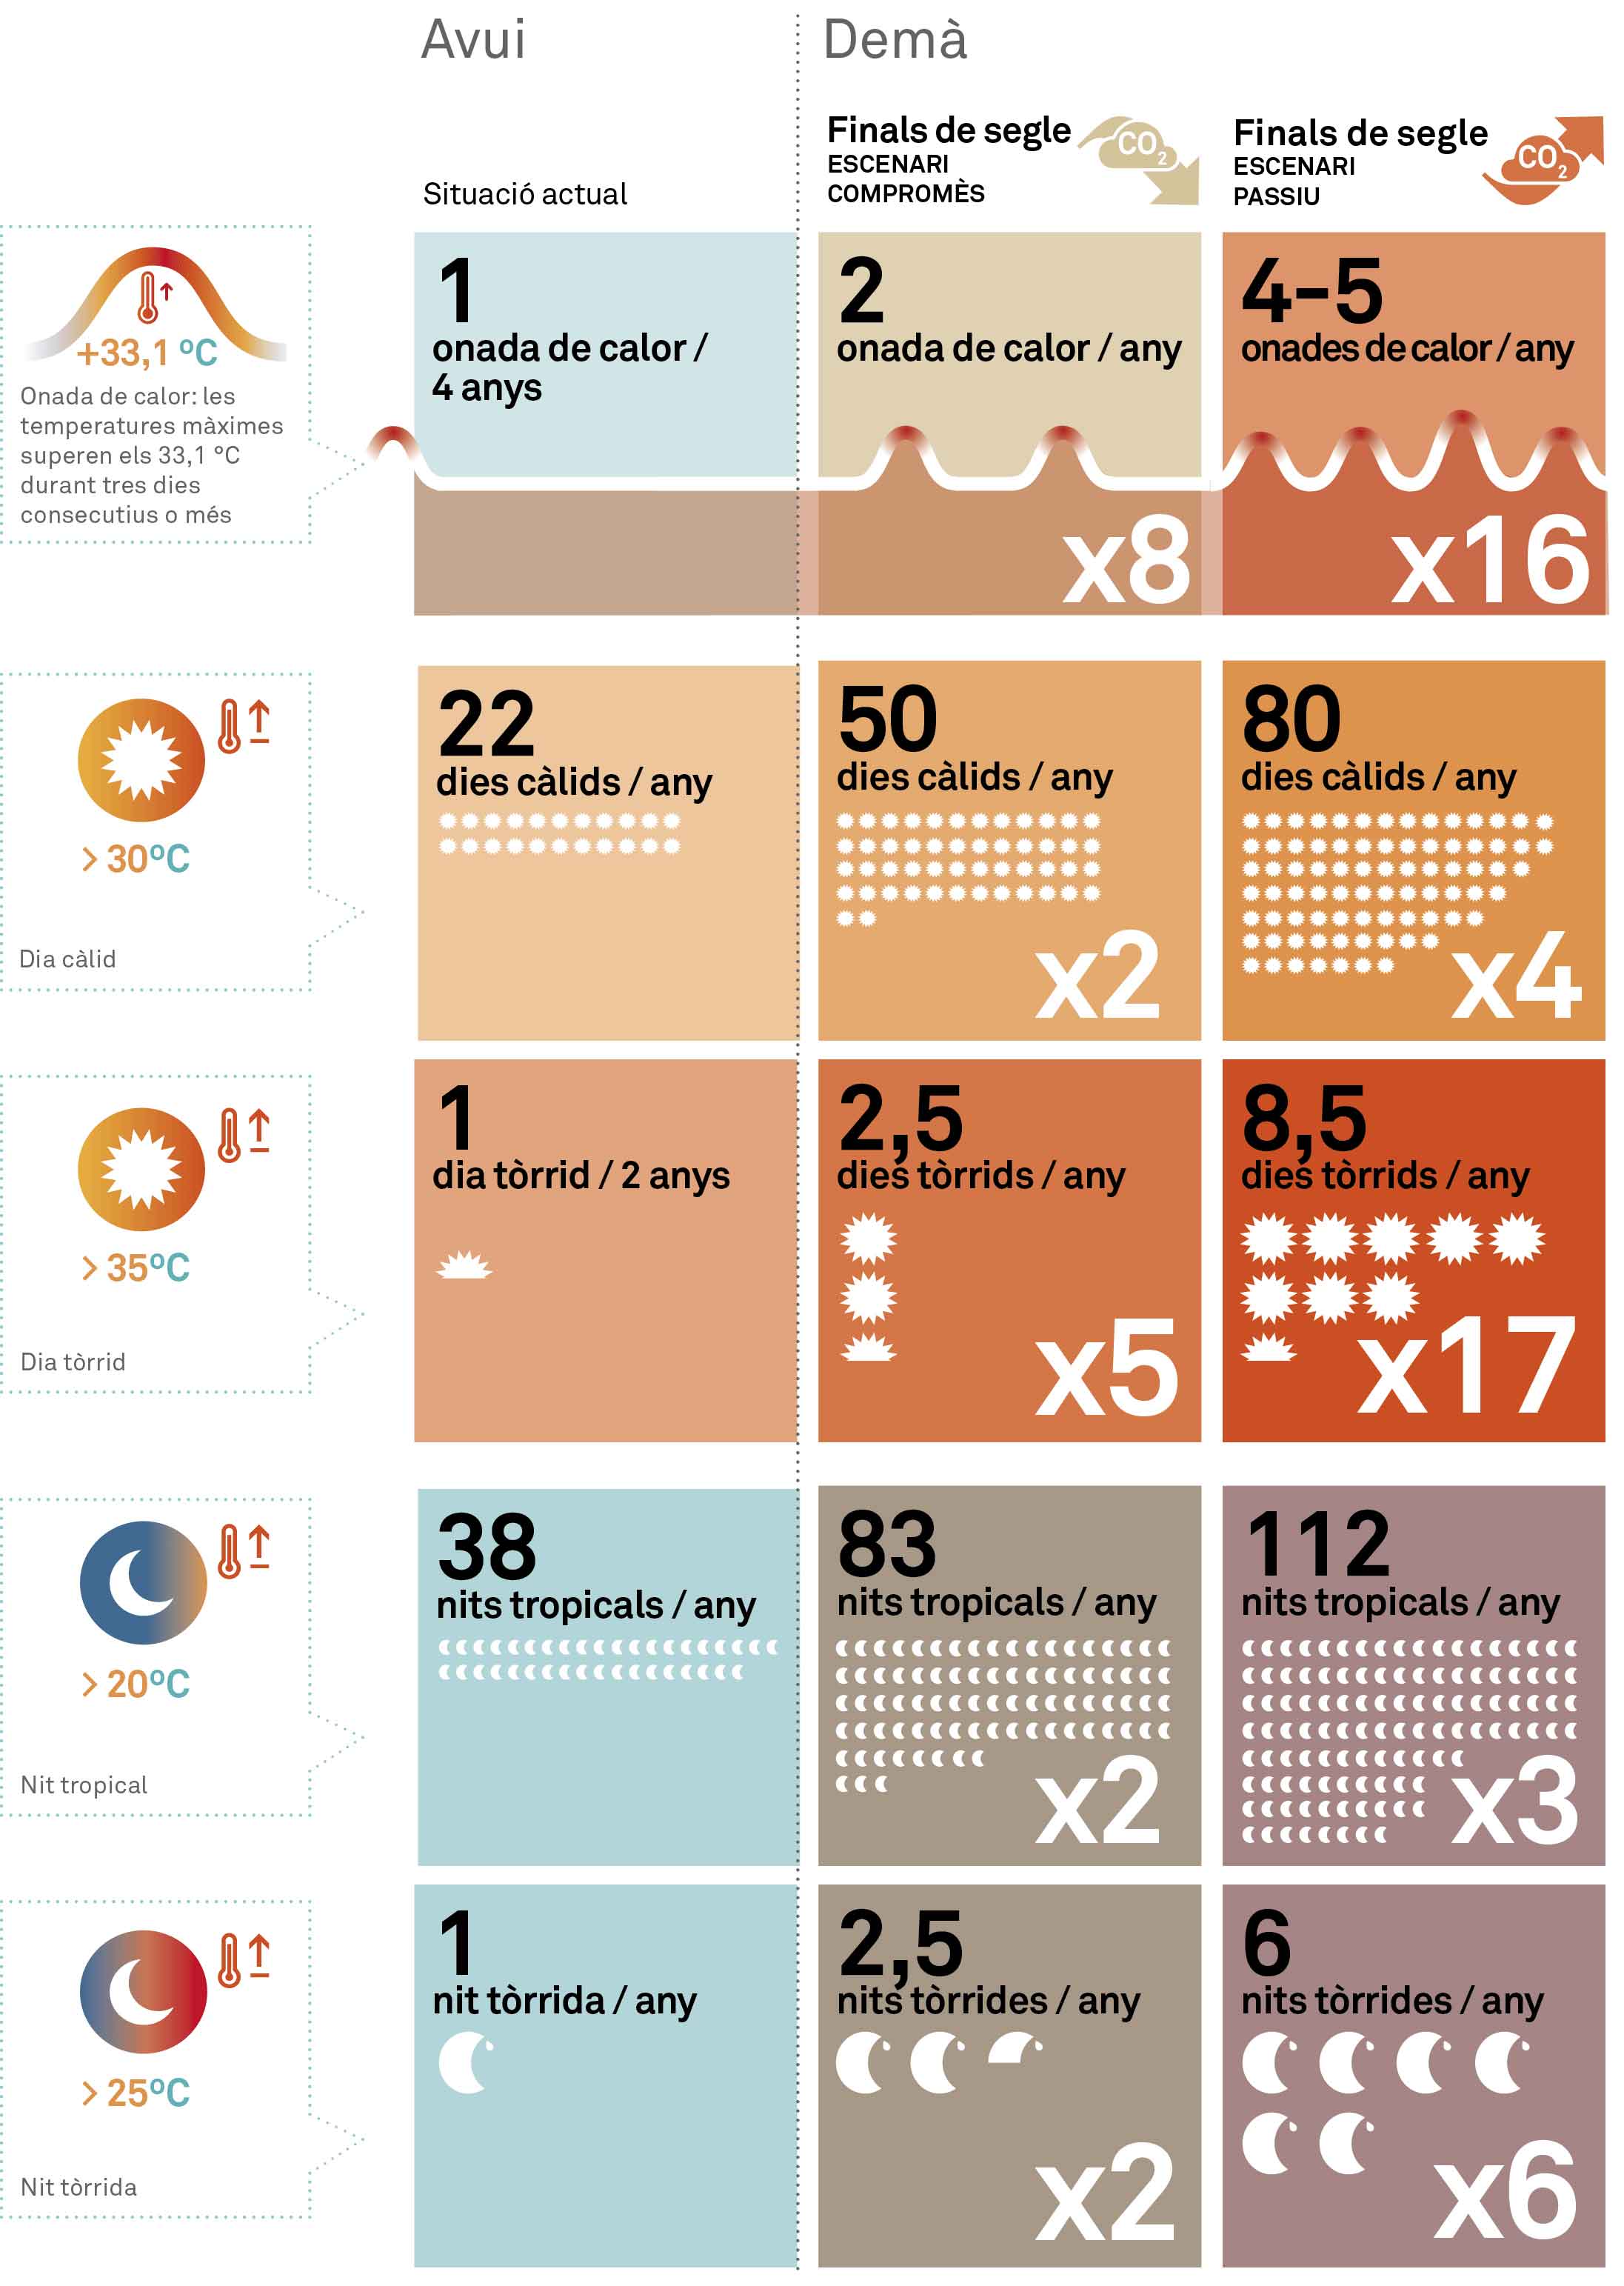
In Barcelona, a heat wave is defined as a situation where maximum temperatures exceed 33.1ºC for three or more consecutive days. Sustained excessive heat leads to an increase in mortality and morbidity, especially among more vulnerable groups, such as elderly people, newborn babies, people with physical or learning difficulties who have limited mobility and ability for self-care, people with chronic illnesses, those who take medication that acts on the central nervous system or those living in socially precarious conditions. It has been calculated that the number of deaths as a consequence of the heat wave in 2003 was 411 (Borrell), although other studies put the figure higher, at 537 (Tobias) and 665 (Martínez-Navarro, F.).

Today

A total of eight heat waves have been counted in the city in the last 34 years, and the most vulnerable areas are concentrated in the neighbourhoods nearest the Besòs sector, part of Horta and a large part of the Sants-Montjuïc district.

Tomorrow

Rising temperatures will have consequences for health but not just in terms of heat waves. Rising temperatures at night could have an impact, as the night-time rest period is when people recover from the heat they have suffered during the day.


These are the Catalan Meteorological Service’s climate projections regarding maximum temperatures and heat waves for Barcelona:

Augment de la temperatura

Exposure

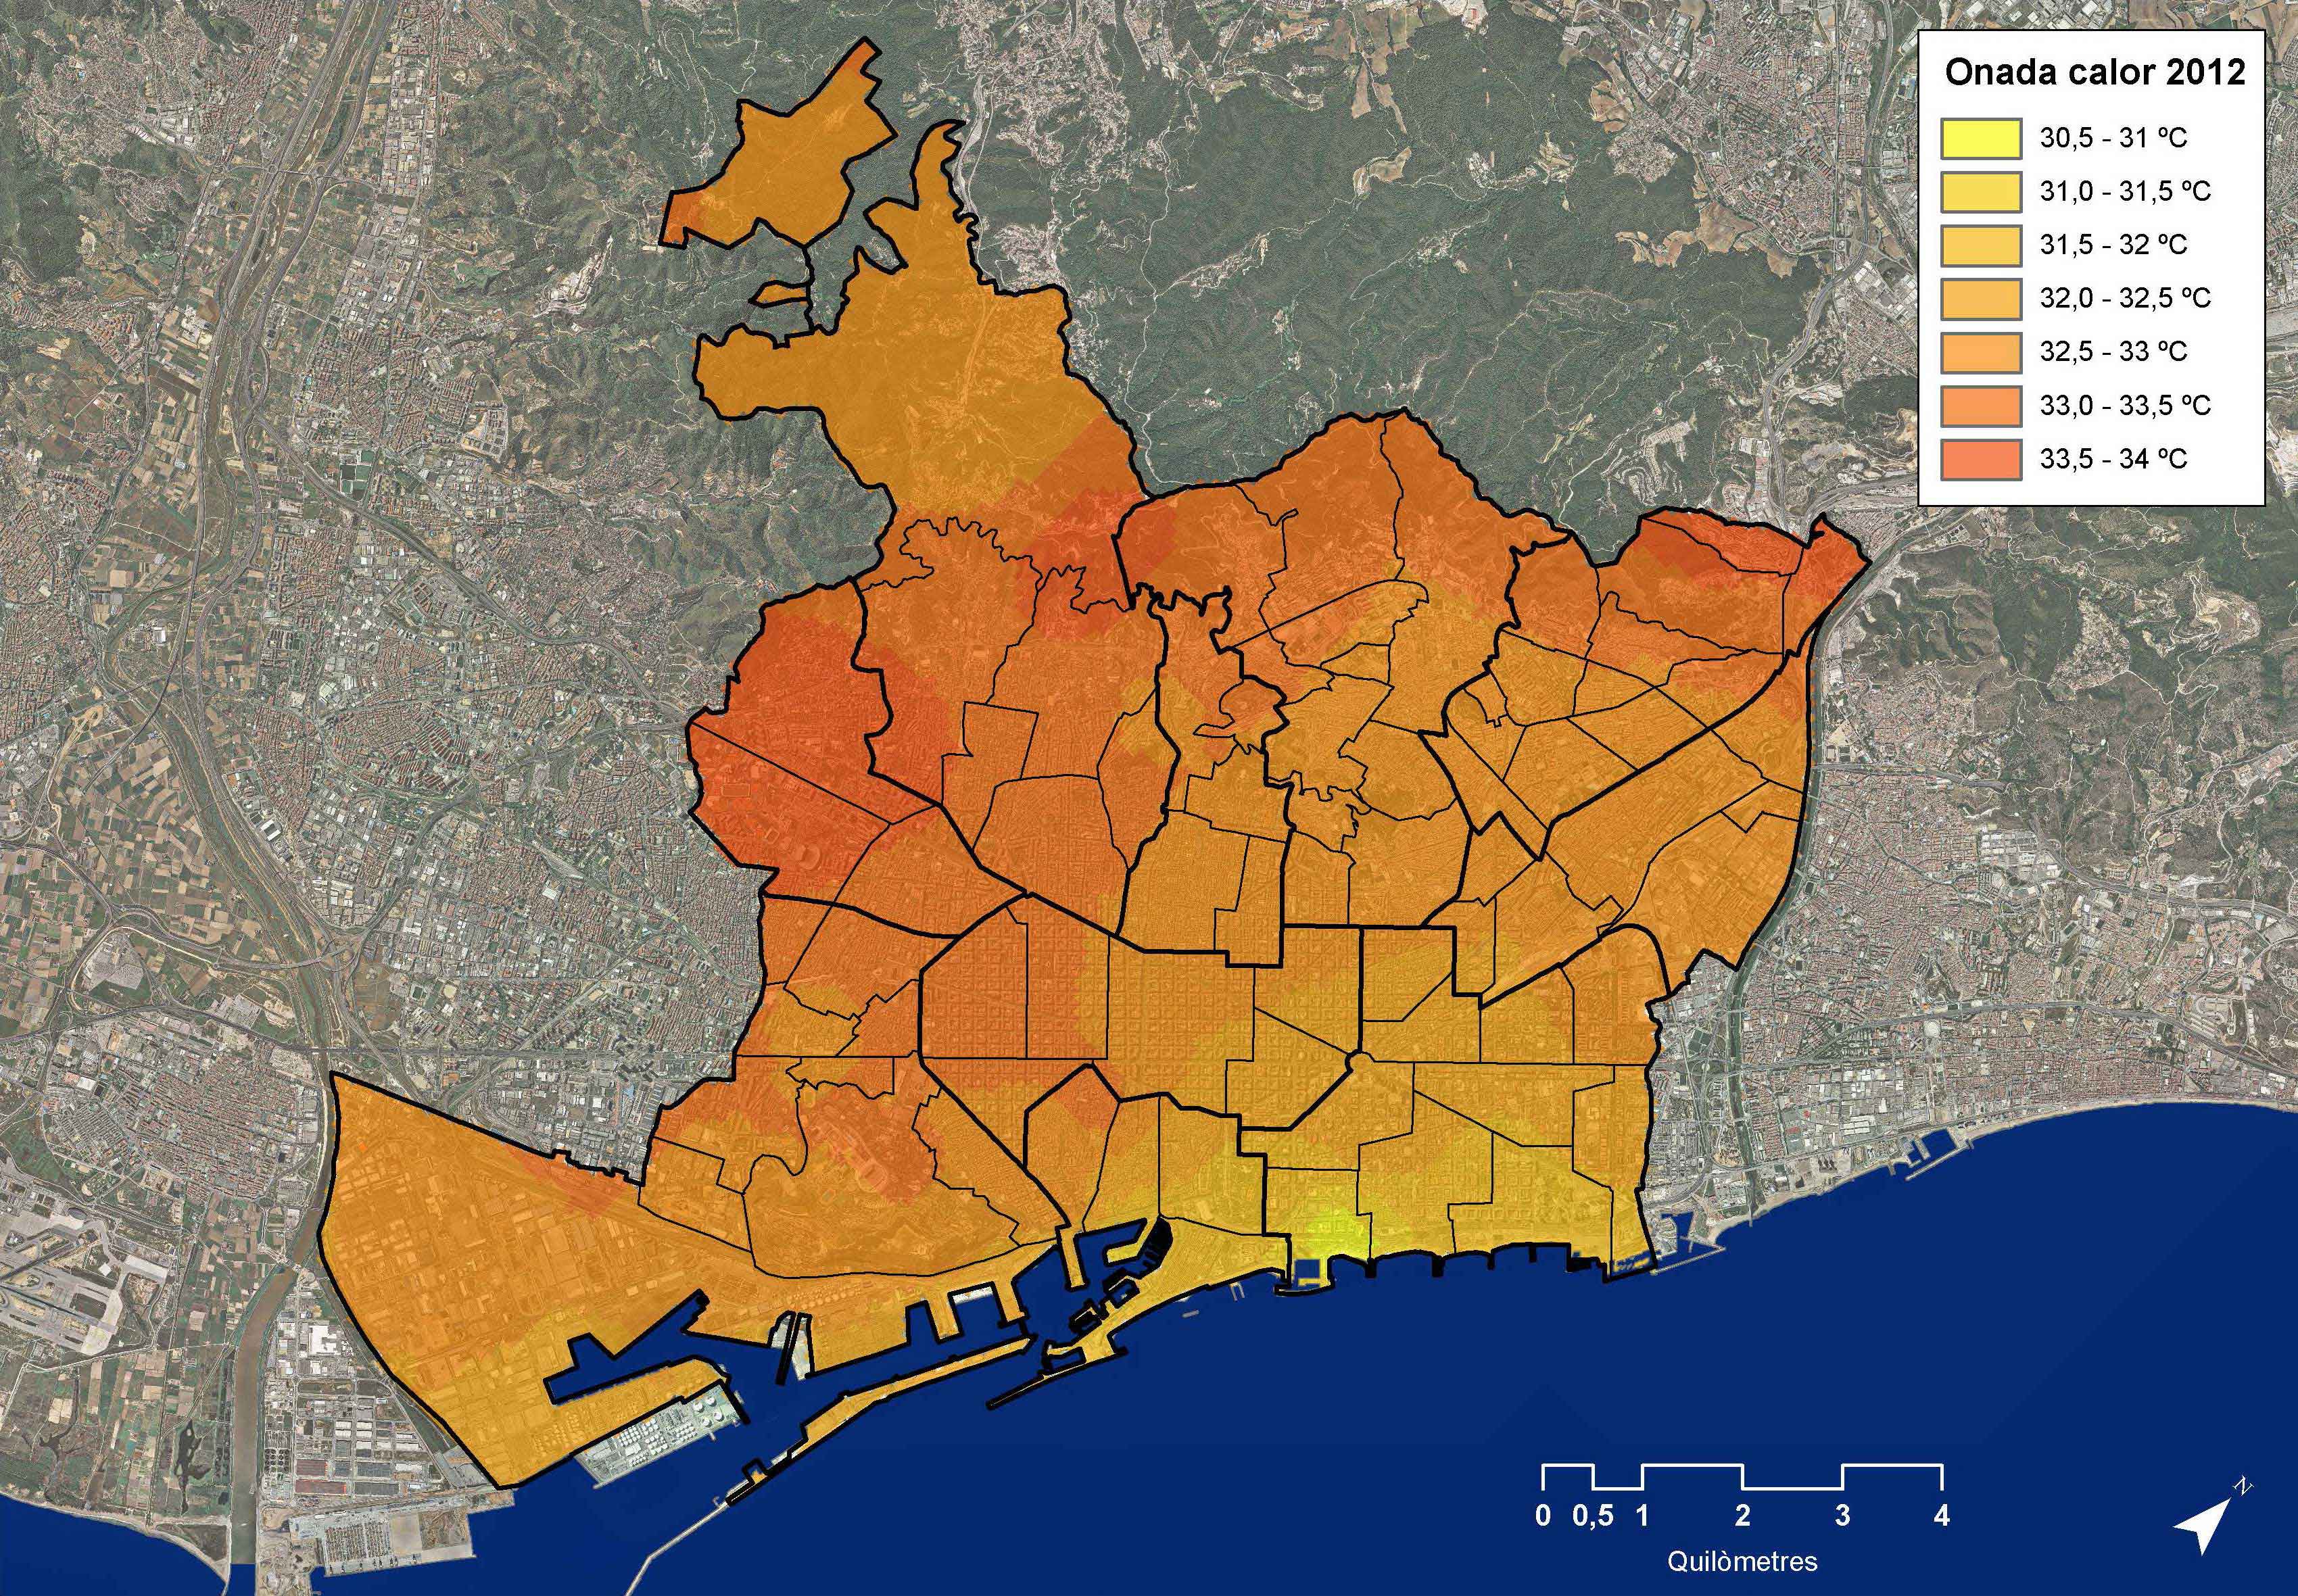
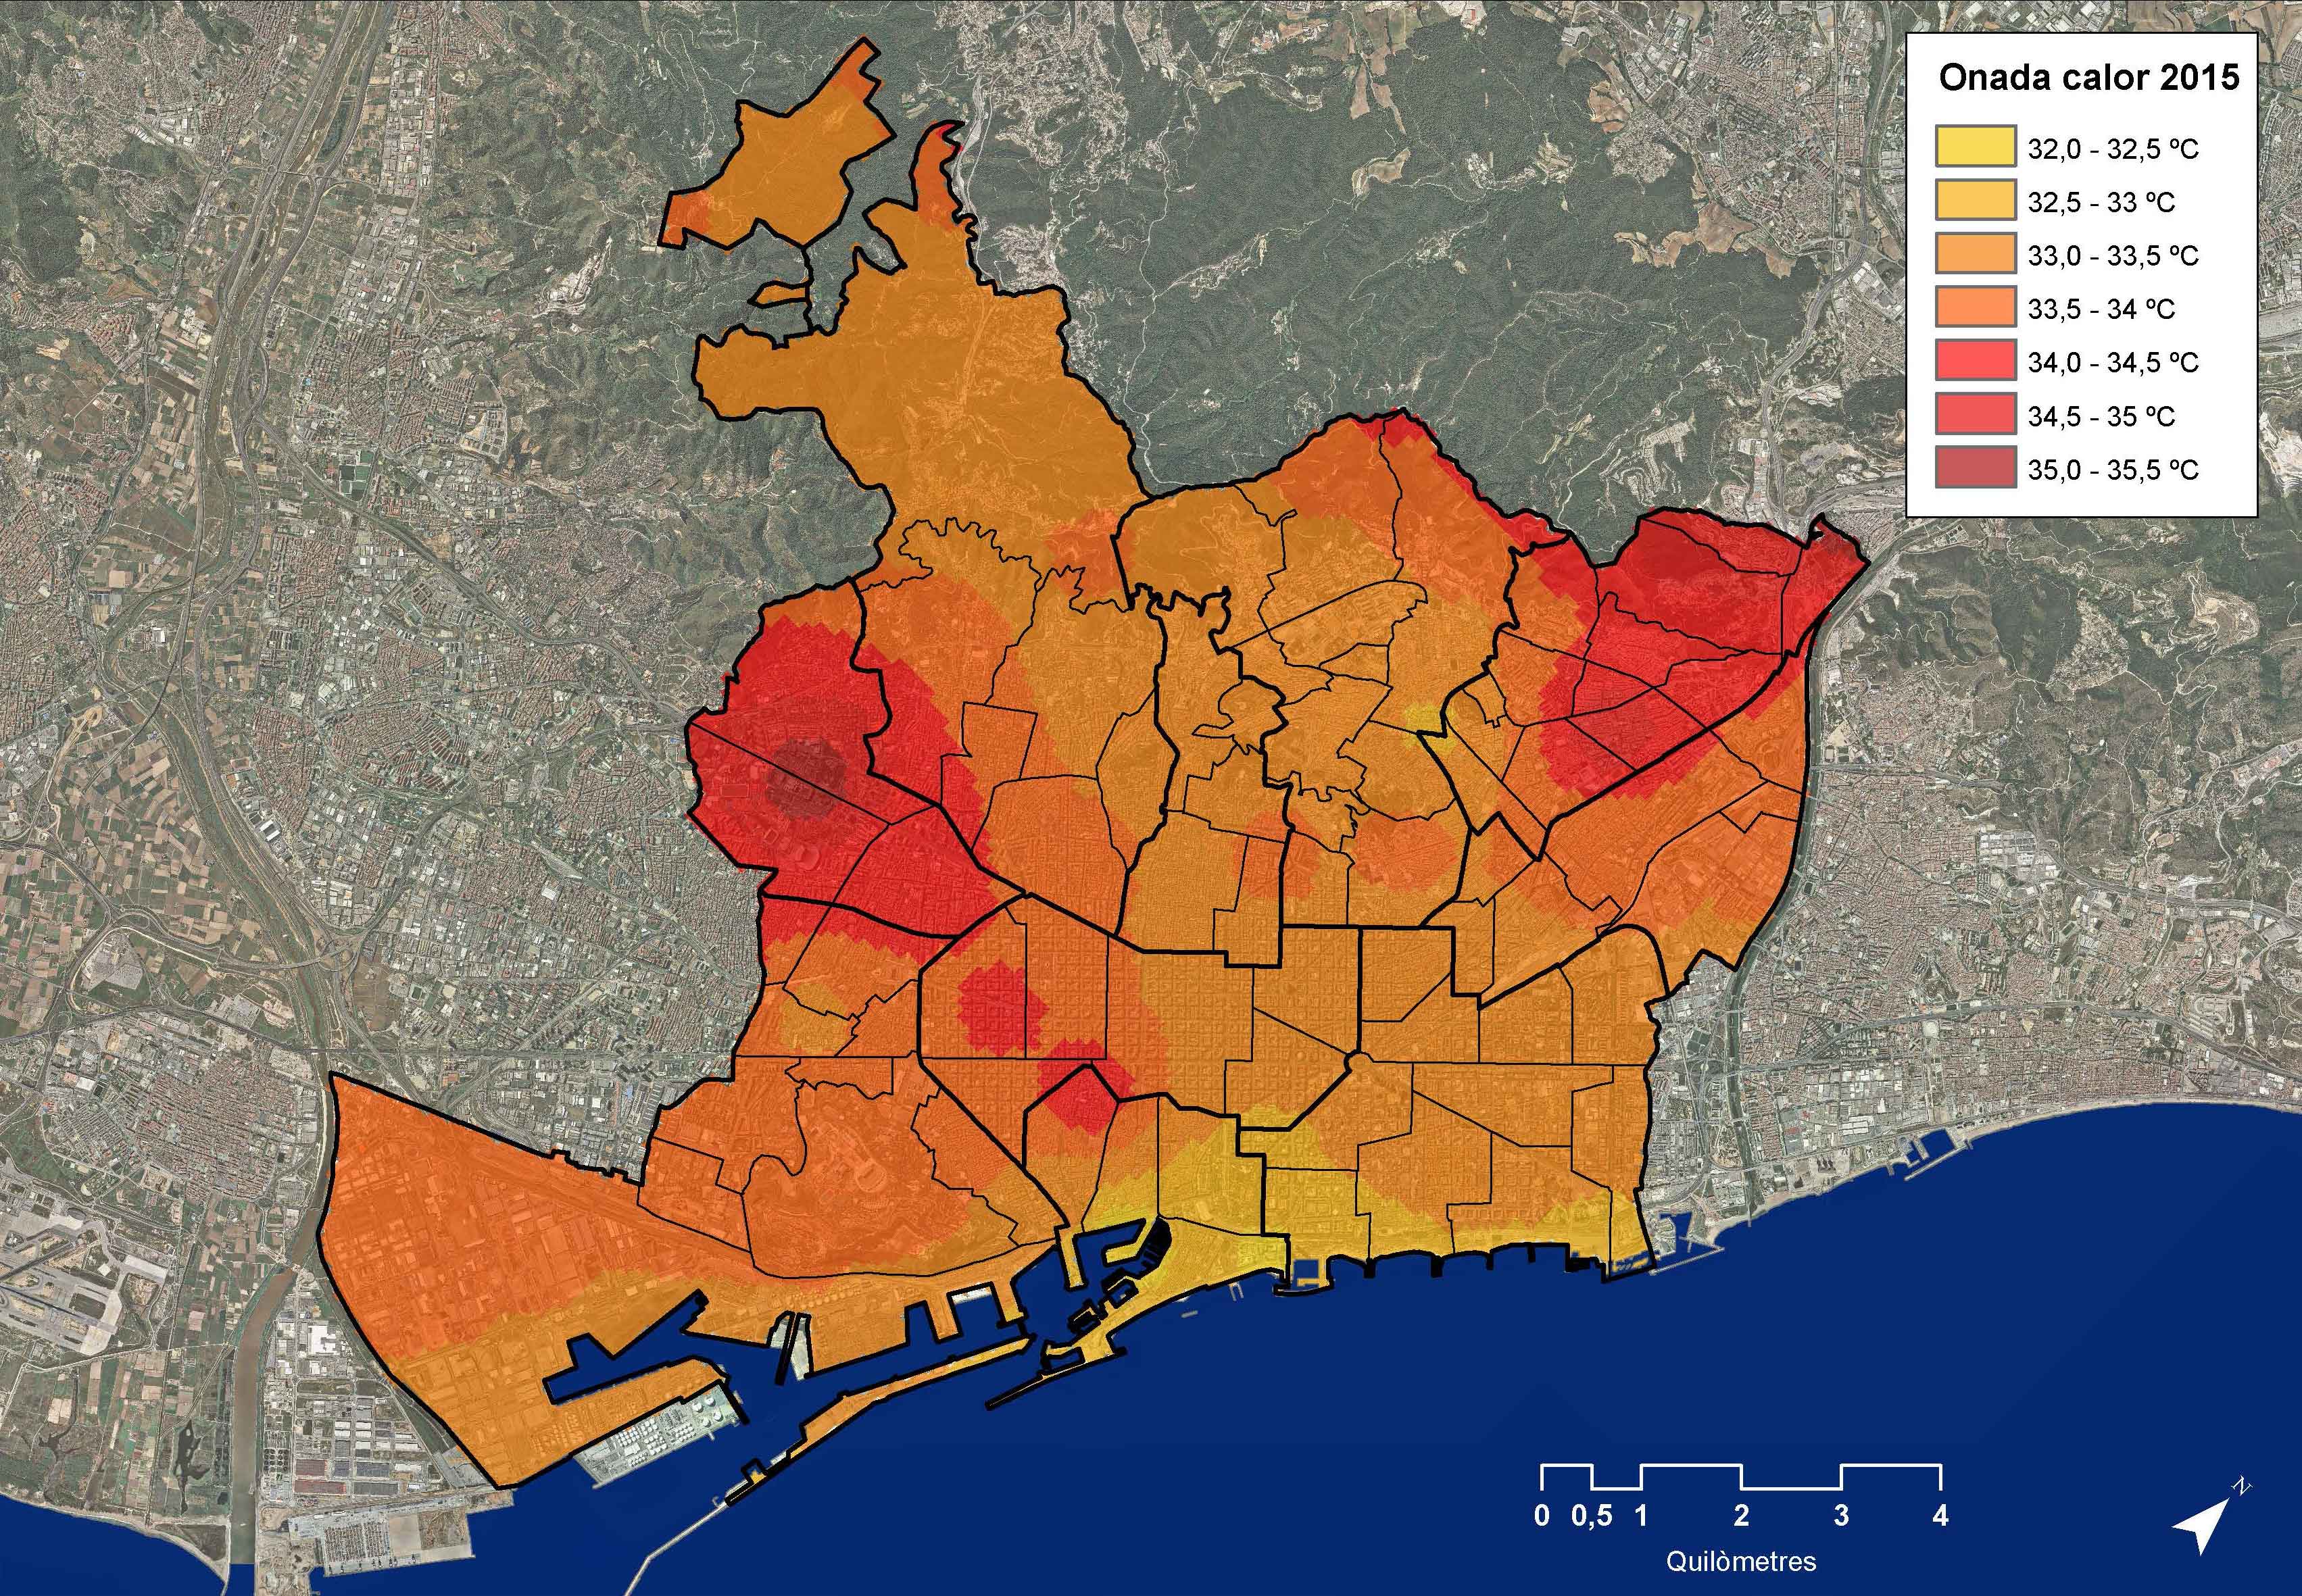
If we analyse the territorial distribution of the last two heat waves in Barcelona, we can see the areas with the highest temperatures are in the Les Corts -La Nova Esquerra de l’Eixample area, the Nou Barris district and Ciutat Vella. On the other hand, the areas where the temperatures are not as high are along the coast, specifically Barceloneta and Poblenou.

Source: Study of the Impacts of Climate Change on Barcelona carried out by Barcelona Regional.

Source: Study of the Impacts of Climate Change on Barcelona carried out by Barcelona Regional.

Vulnerability factors

To find out the overall effect of heat on Barcelona, various factors that make the city more vulnerable to suffering the consequences of heat and which, moreover, are not distributed evenly across the city.

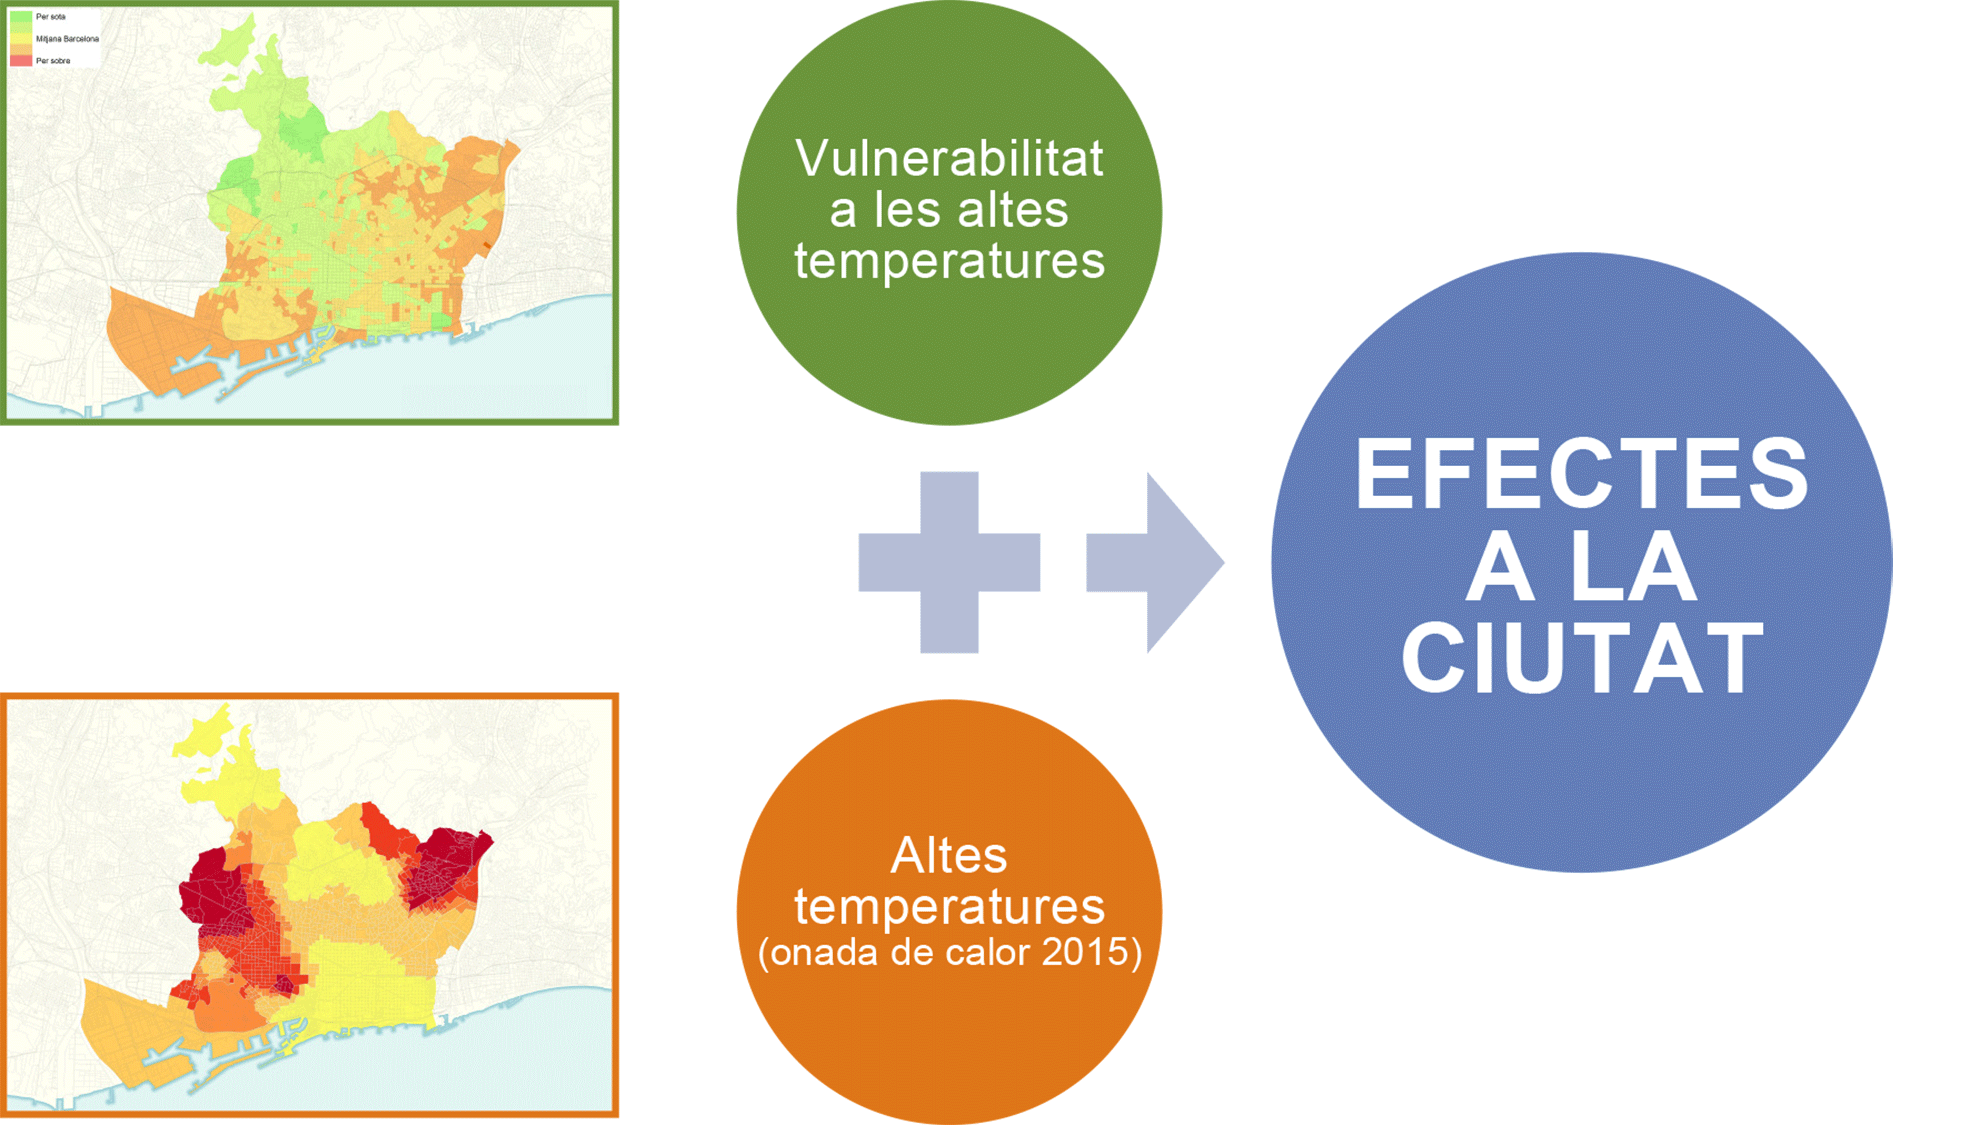
Once the vulnerability parameters had been analysed, they were superimposed on the areas exposed to higher temperatures during the 2015 heat wave, as this was the most extreme of the two waves studied.

The first step was to pass the 2015 heat wave temperature over the census section and differentiate the areas based on the highest and lowest temperatures. Then the heat map was crossed with the vulnerability factors that have been taken into account and which are related with the population, urban, energy and socio-economic characteristics of the urban fabric, as described further on.

That enables us to see the areas where action is more of a priority, because the effects on the population are greater, and what kind of measures need to be implemented (more greenery, protection for people sensitive to heat, increased energy efficiency in buildings or socio-economic measures).


When considering a possible approach to vulnerability in heat waves, we consulted the Barcelona Public Health Agency (ASPB) so we could decide jointly which were the most relevant variables for characterising vulnerability throughout the city.

As a result of consulting the ASPB, we concluded that the most relevant aspects for identifying vulnerability in heat waves were basically related with population, urban, energy and socio-economic characteristics.

There follows a territorial analysis of these parameters, to see which parts of the city are more or less at risk.

The maps show the information on a census section level, as much of the data used have this level of detail. Their representation is based on parameter standardisation, i.e. deviation from the city average. So, the best values – the ones less vulnerable to heat – are shown in a range of greens and the worst in a range of reds.

Energy behaviour of buildings. Theoretical demand for cooling

The parameter adopted to try to classify the degree of mitigation or vulnerability in heat waves offered by residential buildings, which is where people spend more time and above all rest at night, was the energy behaviour of buildings. More specifically, that means the theoretical demand for cooling for different types of buildings*, where higher energy demand for cooling means they are more vulnerable to heat waves.

(*Based on the classification of residential building types in Barcelona established by Barcelona Regional in the work carried out by Barcelona City Council under the Energy, Climate Change and Environmental Quality Plan [PECQ in Catalan].)


Source: Study of the Impacts of Climate Change on Barcelona carried out by Barcelona Regional.


Population over 75

Heat waves are particularly harmful for certain groups, such as the elderly, babies and the chronically sick. Of those risk groups, only the elderly were deemed relevant. That was because newborn babies are usually well protected and looked after by their carers in high temperatures, while the chronically sick were discounted because it is difficult to obtain data on where they live. The age cut-off point of over 75 years old is in line with ASPB criteria and was adopted for the CREAL (Environmental Epidemiology Research Centre) study based on the heat wave in Barcelona in 2003.
The map, based on the municipal register of residents for 2015, shows on a census section level those areas of Barcelona where there is a greater or lesser concentration of the population over 75 compared to the city average.


Source: Study of the Impacts of Climate Change on Barcelona carried out by Barcelona Regional.


Absence of vegetation

The lack of greenery has been included as one of the decisive urban aspects because it increases vulnerability to high temperatures. Any vegetation in the urban fabric has a thermoregulatory effect and mitigates high temperatures. In order to analyse whether or not vegetation is present in different areas of the city, we have used the NDVI (Normalized Difference Vegetation Index), which uses satellite images to assess the quantity and quality of vegetation.
Below we show the NDVI values at census section level, indicating the areas where vegetation is close to the city average, below it (shaded red) or above it (shaded green).


Source: Study of the Impacts of Climate Change on Barcelona carried out by Barcelona Regional.


Level of education

A good indicator for showing socio-economic characteristics is insufficient education. This indicator was provided by the Barcelona Public Health Agency and shows what percentage of the population aged 16 and over is illiterate or has no formal education, compared to the total population in this age band, and it shows a socio-economic situation that could make them more vulnerable to heat waves.
The information is shown at census section level.


Source: Study of the Impacts of Climate Change on Barcelona carried out by Barcelona Regional.


Overall vulnerability

Having identified what we considered to be the four most representative parameters and with data available that would enable them to be represented territorially in order to analyse the degree of vulnerability in the different parts of Barcelona, we aggregated and represented them in a single map.
This map gives us an approximation of overall vulnerability to heat waves in the city.


Source: Study of the Impacts of Climate Change on Barcelona carried out by Barcelona Regional.

Results


Heat vulnerability maps

Having ascertained the city’s vulnerability, it is important to cross that information with the areas most exposed to high temperatures during previous heat waves. That will help us, for example, to detect the most vulnerable points in the city and those which recorded higher temperatures. Those places are the main points where we need to act.
In this section we will analyse the city’s overall vulnerability to the heat wave in 2015, as that was the hottest of the two waves studied, and the partial vulnerability with regard to the four factors considered, as the areas where the effects of each parameter were highest are different. These maps will help to specify the measures of each kind – more greenery, energy efficiency of buildings or socio-economic measures – in the various neighbourhoods and where action is a priority.


Vulnerability by energy behaviour of buildings

The map uses warm colours to show the areas with a higher level of vulnerability, taking into account the fact that they are more exposed to high temperatures and the concentration of buildings characterised by a higher theoretical demand for cooling.


Source: Study of the Impacts of Climate Change on Barcelona carried out by Barcelona Regional.


Vulnerability by population >75

The map shows those areas of the city that are more or less vulnerable than the average for Barcelona taking into account their degree of exposure (maximum temperatures recorded during the heat wave in 2015) and the concentration of people over 75.


Source: Study of the Impacts of Climate Change on Barcelona carried out by Barcelona Regional.


Vulnerability by absence of vegetation

The map shows those areas of the city that are more or less vulnerable than the average for Barcelona taking into account their degree of exposure (maximum temperatures recorded during the heat wave in 2015) and the presence of more or less vegetation.


Source: Study of the Impacts of Climate Change on Barcelona carried out by Barcelona Regional.


Vulnerability by level of education

The map uses warm colours to show the areas with a higher level of vulnerability, taking into account the fact that they are more exposed to higher temperatures and the concentration of people with insufficient education which, according to the Barcelona Public Health Agency is the most representative indicator of the groups most vulnerable to heat in the socio-economic sphere.


Source: Study of the impacts of climate change on Barcelona carried out by Barcelona Regional.


Overall vulnerability

The map uses warm colours to show the areas with a higher vulnerability level, taking into account their greater exposure to high temperatures and the overall level of vulnerability resulting from aggregating the four parameters considered.


Source: Study of the Impacts of Climate Change on Barcelona carried out by Barcelona Regional.

Adaptive capacity

Although climate change will increase the intensity and frequency of heat episodes, this is not a new risk for Barcelona and the city is already applying measures to combat their effects on health. The combination of these measures and the city’s characteristics that make it resistant to heat is what we call adaptive capacity.

The Specific Municipal Emergency Plan for Heat Waves is one measure and there are other structural measures that are now beginning to be implemented, such as increasing the quantity and quality of urban greenery in the city, as this provides shade and coolness with the temperature falling up to 3ºC in some parks, or encouraging energy renovation to improve the thermal comfort and characteristics of buildings and public facilities.

The Climate Plan is pushing a new line of action called “Climate shelter spaces” to promote the creation or adaptation of spaces that people could be directed to in the event of heat episodes. The Study on the Impacts of Climate Change in Barcelona included an initial analysis of the facilities and green spaces in the city that it was felt could offer this service, with the aim of getting an initial idea of the extent of territorial cover of potential shelters in relation to the vulnerable population. Work is currently being done to go into more detail with this study.

For further information on this and other measures, you can consult the contents of the Climate Plan:

Climate shelter spaces and facilities

It is important to know which places the most vulnerable population can go to when there is a heat wave to protect themselves from its effects. To carry out an initial study of the extent of territorial cover for vulnerable people (over 75) provided by the current potential shelter spaces, we chose public facilities with a big capacity that might have better climate comfort conditions because they have air conditioning or other cooling features.

The following shelter facilities were considered:

- Public libraries
- Sports complexes*

*It is worth pointing out that some sports complexes do not have air conditioning and, therefore, would not be the most suitable places for sheltering people at times of high temperatures. But there was no information available on-air conditioning in these complexes for the study, so they have all been included. Subsequently it will be necessary to refine this analysis, so we know which shelter facilities are the most suitable.

However, Barcelona also has other amenities that could serve as a reception point for people at the hottest times, namely the city parks. We chose the ones with a notable presence of greenery and which cover a relatively big area (over 1 ha).

The map shows the degree of territorial cover provided by parks and potential shelter facilities measured by walking time up to 10 minutes.


Source: Study of the Impacts of Climate Change on Barcelona carried out by Barcelona Regional.


Shelter capacity of shelter spaces for the vulnerable population (over 75)


We also analysed the degree of “saturation potential” of theses parks and shelter facilities, that is their capacity for sheltering the most vulnerable population (over 75) in their vicinity, taking into account the area established for each of these spaces is 10 minutes walking distance. The map uses colour grading where the areas highlighted in red and orange have a very high potential vulnerable population (more than 2000 people over 75).

Source: Study of the Impacts of Climate Change on Barcelona carried out by Barcelona Regional.
To consult the full study, click HERE (in Catalan).
nt.match(/Trident.*rv\:11\./)) { $('html').addClass('ie11'); }